The Azure Network Watcher provides monitoring and logging for Infrastructure-as-a-Service (IaaS) resources in Azure virtual networks. Azure automatically deploys the Azure Network Watcher when you create or update an Azure virtual network in your subscription. However, if you’re not sure what the resource is, you may end up deleting it not knowing it is an essential function.
Discover your weak points and strengthen your resilience: Run a Free Ransomware Readiness Test
In this post, you will learn more about the Azure Network Watcher, including components for network troubleshooting. You will also learn how to create the Network Watcher if you inadvertently remove it.
What is Azure Network Watcher?
The Azure Network Watcher provides multiple tools for monitoring and repairing IaaS network health. Microsoft designed Network Watcher for virtual machines, virtual networks, application gateways, and load balancers.
Network Watcher is not suited for Platform-as-a-Server (PaaS) offerings or Web Analytics. To monitor those PaaS resources, check out other Azure services such as Application Insights, Azure Monitor, and Log Analytics.
Elements of Azure Network Watcher
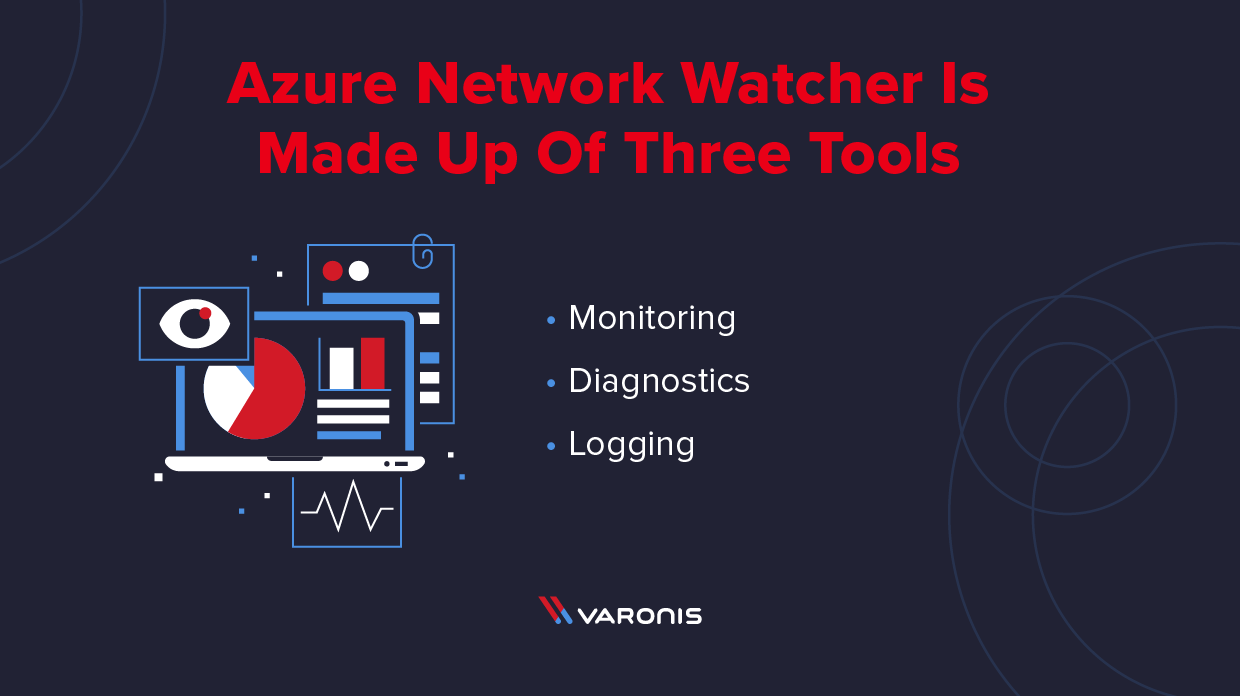
Network Monitor contains several tools for managing your IaaS resources. These tools include monitoring, diagnostics, and logging.
The Monitoring Elements
Network Watcher monitors different endpoints such as virtual machines (VM), a fully qualified domain name (FQDN), or uniform resource identifier (URI), or an IPv4 address. The connection monitor reports on communication between two endpoints, such as reachability, latency, and network topology changes.
For example, you have a VM hosting a website that needs to communicate with another VM hosting a database. If someone applies a new route or network security rule that blocks this communication, Connection Monitor notifies you that the endpoint is unreachable and the reason why. You also use Connection Monitor to perform a connection test at a specific time.
The network performance monitor verifies and reports on the performance between various network infrastructure endpoints. It also monitors network links to on-premises infrastructure through a VPN or Azure ExpressRoute. Network performance monitor detects issues like traffic blackholing and routing errors. When resources breach a network link’s capacity, it can send alerts on the performance issue.
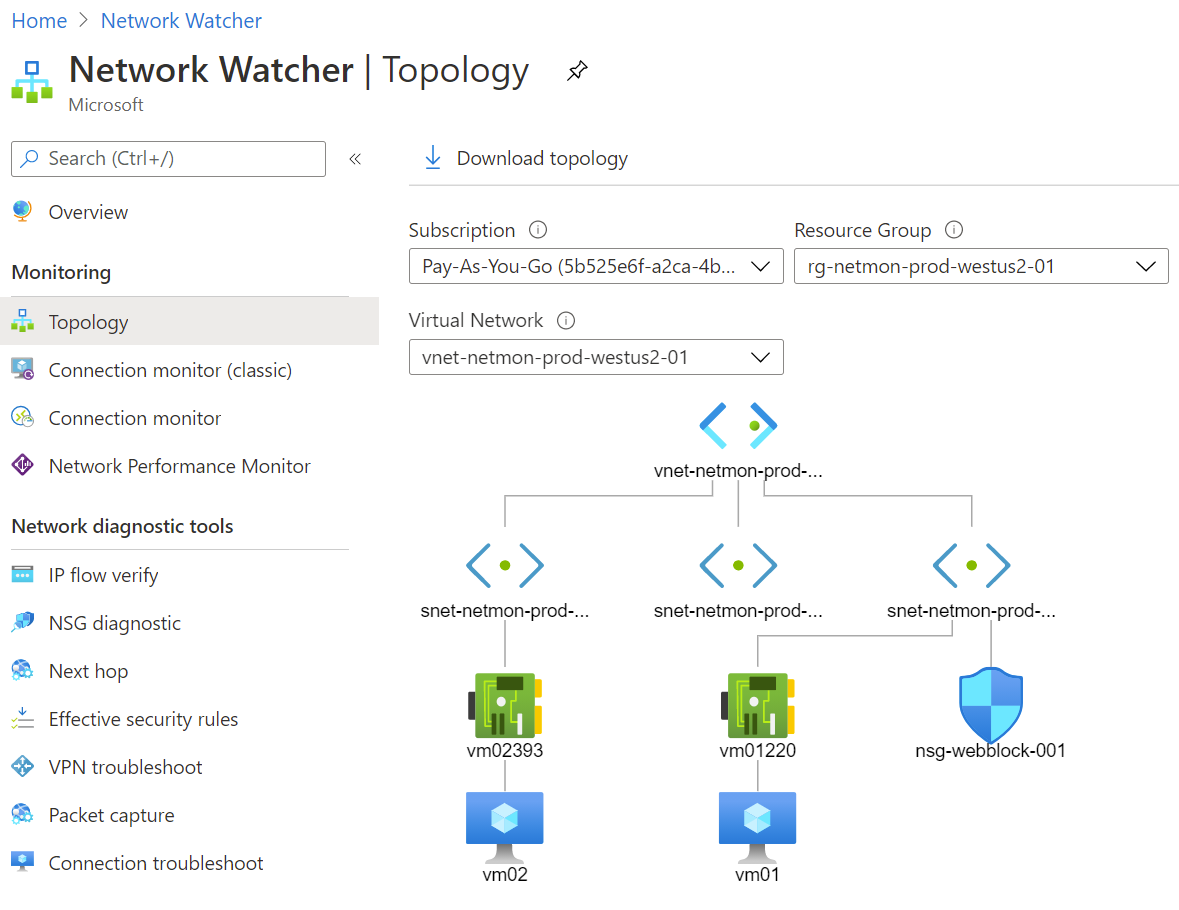
Monitoring also provides infrastructure topology diagrams. The diagram outlines virtual networks, subnets, resources, and network security groups. To generate a diagram:
- In the Azure Portal, search for the Network Watcher resource.
- In Network Watcher, under Monitoring, select Topology.
- Select the subscription, resource group, and virtual network to generate the diagram.
- Select Download topology to save the diagram in the SVG file format.
The Network Diagnostic Tools
Network Security Groups (NSG) contain rules that determine if network traffic can flow between two endpoints. Azure creates NSGs with default rules for allowing traffic between subnets or out to the Internet. You make additional rules to allow or block other traffic based on the virtual machine’s network requirements. The rules contain information such as source and destination IPv4 addresses, ports, protocols, and traffic direction.
At some point, you may create a rule that ends up blocking traffic and impacting a VM’s workload. You use the IP flow verify tool to test communication between endpoints and whether the connection is successful. It then shows which rule the culprit is in either allowing or denying the traffic.
For example, from the topology diagram earlier, nsg-webblock-001 is attached to a subnet and blocks outbound connections on port 80. This rule means vm01 will not be able to connect to vm02 over port 80.
To test this, navigate back to Network Watcher and choose Network diagnostics tools > IP flow verify. In the IP flow verify window, input the subscription, resource group, virtual machine name, and network interface to test. For packet details, select TCP and Outbound. The Local IP address is already populated based on the network interface. Input an ephemeral port (0-65535) as the local port to test from on the VM.
For the Remote IP address, enter the IP address of a VM on a different subnet in the same virtual network. Since the NSG is blocking port 80, this should also be the Remote port to test.
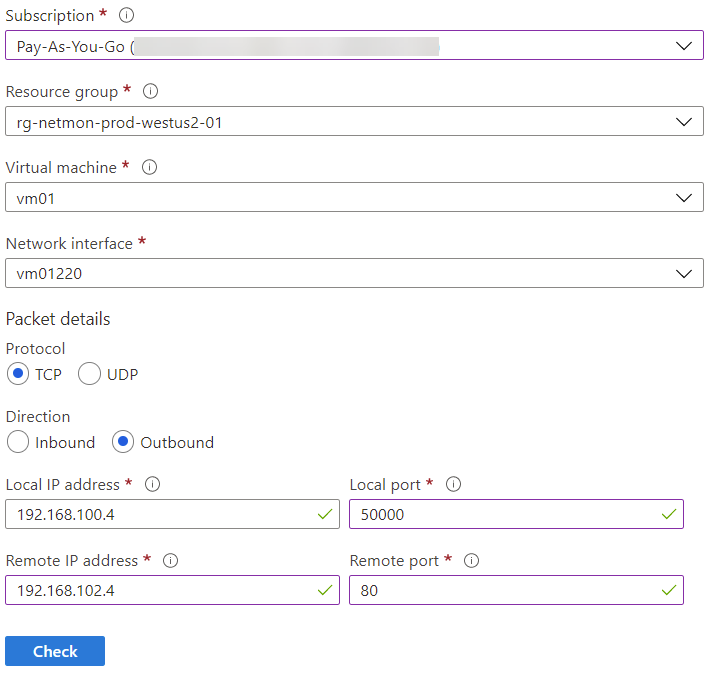
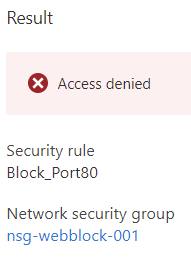
Once the test information is confirmed, select the Check button to start the diagnostic. Azure displays the results of the test. In this case, it failed, and Azure shows which security rule in which NSG is the culprit for blocking the communication.
Network Watcher contains several other diagnostic tools for verifying your IaaS infrastructure.
- NSG diagnostic: Provides detailed information on the network’s security configuration including all the NSGs that traffic will traverse.
- Next hop: This shows the next hop a VM will take to its destination IP address. Useful for verifying routing tables.
- Packet capture: Create packet capture sessions to and from a VM to diagnose network traffic issues.
- Connection troubleshoot: Check TCP connections from a VM to another VM, FQDN, URI, or IPv4 address.
The Logging Capabilities
Network Monitor provides logging for different Azure resources. The NSG flow log logs whether or not traffic was allowed or denied by an NSG. You analyze the logs using various tools, one being Microsoft’s PowerBI and the traffic analytics capability. PowerBI displays the log data using rich visualizations.
You can also enable diagnostic logging for NSGs, VM network interfaces, public IP addresses, load balancers, virtual network gateways, and application gateways. Each resource can have up to 5 diagnostic settings. Azure captures the diagnostic logs and exports them to a data store of your choosing. Destinations include Log Analytics workspace, Event Hubs, and Azure Storage.
Pricing for Azure Network Watcher
When Azure creates a Network Watcher, there is no impact on other resources or associated charges for enabling it. However, some of the elements described earlier do have a cost. Pricing varies based on region and availability of services. The following units and pricing is an example for the East US Azure region.
For example, you collect up to 5 GB per month of network logs, but Microsoft then charges $0.50 per GB of logs collected. The Network Watcher stores logs in a storage account where you set a retention policy of up to 365 days. If you do not set a retention policy, Azure maintains the logs forever.
Network Watcher includes 1,000 checks per month of the Network Diagnostic Tool. When you reach this limit, Microsoft charges $1 per 1,000 checks. Connections Monitor includes 10 tests per month, then has tier-based charging depending on how many tests it performs. As the number of tests increases, the price per test decreases.
- 10 to 240,010 tests – $0.30 per test per month
- 240,010 to 750,010 tests – $0.10 per test per month.
- 750,010 to 1,000,010 tests – $0.05 per test per month
- 1,000,010 and up tests – $0.02 per test per month
To view more information for your particular region, visit Microsoft’s Network Watcher pricing page found here.
How to Create Network Watcher in Azure
Microsoft automatically creates the Azure Network Watcher when you create or update an Azure virtual network in your subscription. Azure makes a resource group named NetworkWatcherRG that contains Network Watchers for each Azure region where it has deployed virtual networks.
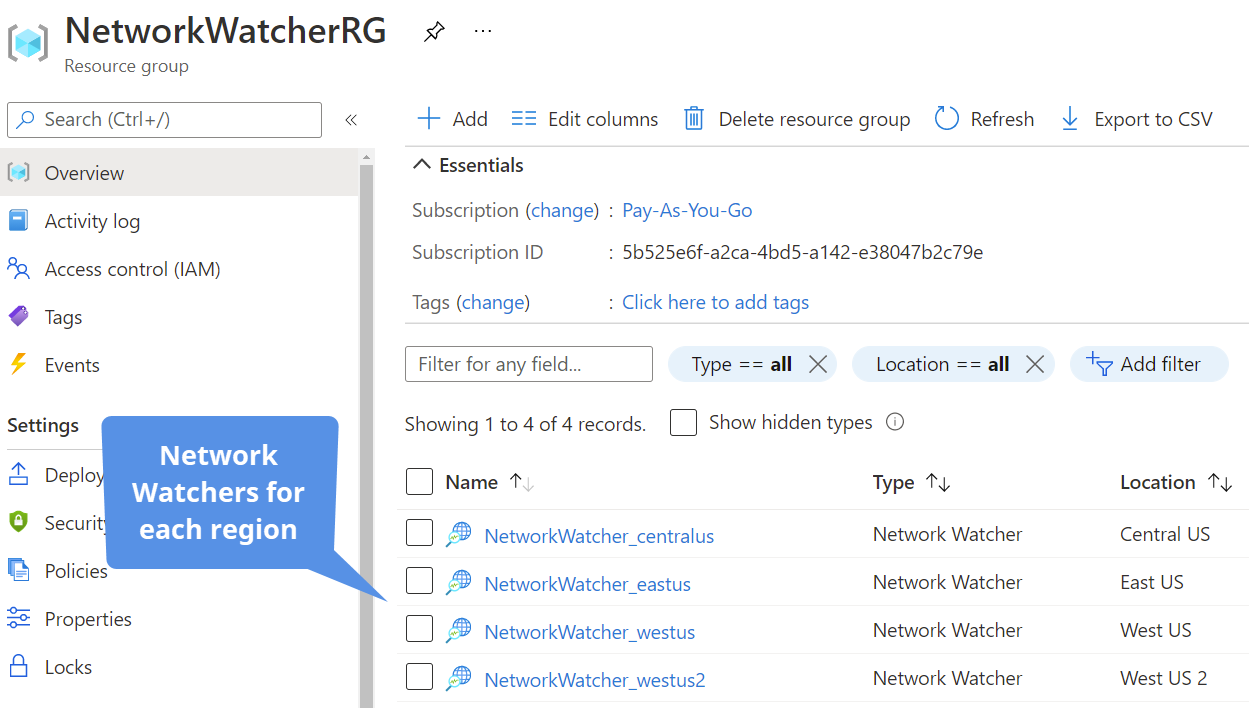
If you do not see anything in the resource group, try selecting the Show hidden types checkbox. Since Azure manages these resources, it did not display these ancillary resources in the resource group. If you did as I did, you saw an empty resource group and deleted it. This action removed the Network Watcher resources, and you lose access to its functionality. I suspect Microsoft now displays the Network Watcher resources to prevent this from happening.
Can you enable the Network Watcher again if you accidentally deleted it? Absolutely! You enable it again through the Network Watcher resource.
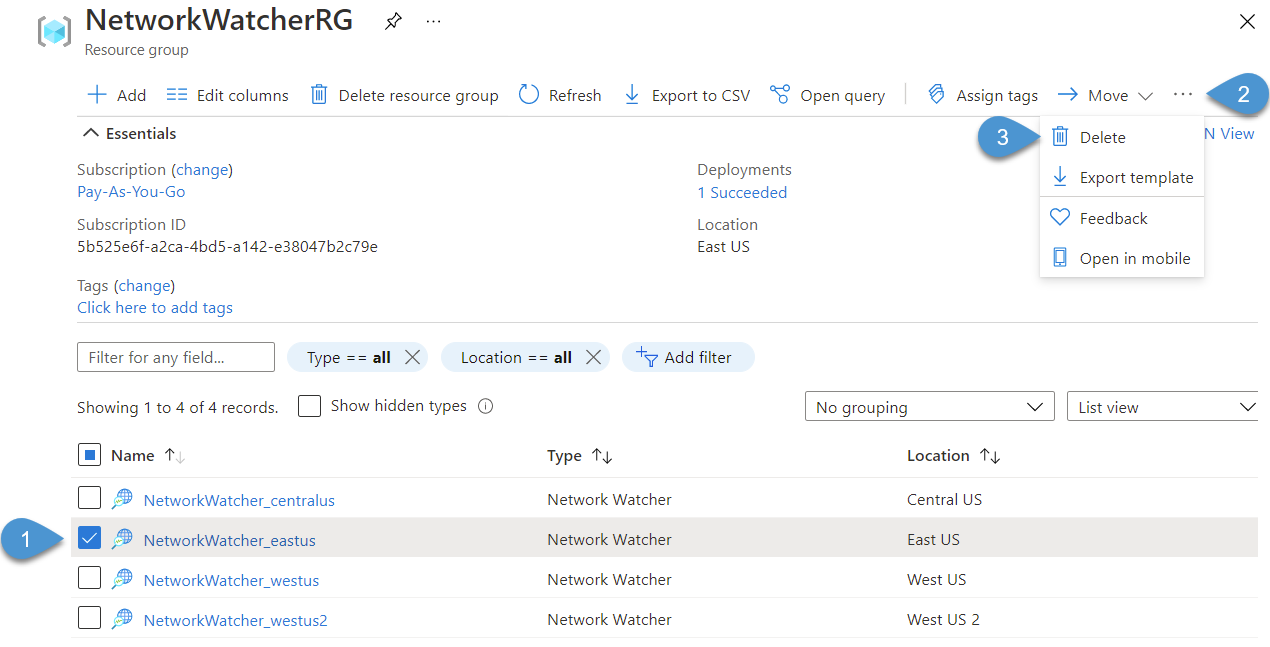
For this demo, delete an existing Network Watcher resource that represents an Azure region in the resource group. Select the check box next to the Network Watcher resource, then choose Delete from the menu (you may need to select the More options ellipses to see the delete option).
To recreate the Azure Network Watcher for a region, follow these steps.
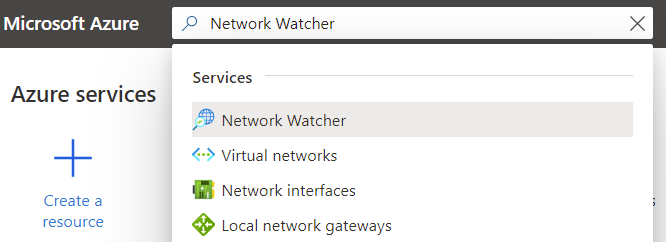
Step 1: Navigate to the Azure Network Watcher Resource
In the search box at the top of the Azure portal, search for “Network Watcher.” Select Network Watcher from the list of services.
Step 2: Select Azure Subscription
In the Network Azure Overview page, expand the regions list next to the Azure subscription by selecting the caret icon. In this example, my subscription is the Pay-As-You-Go subscription. This action expands the list of regions and if Network Watcher is enabled or not.
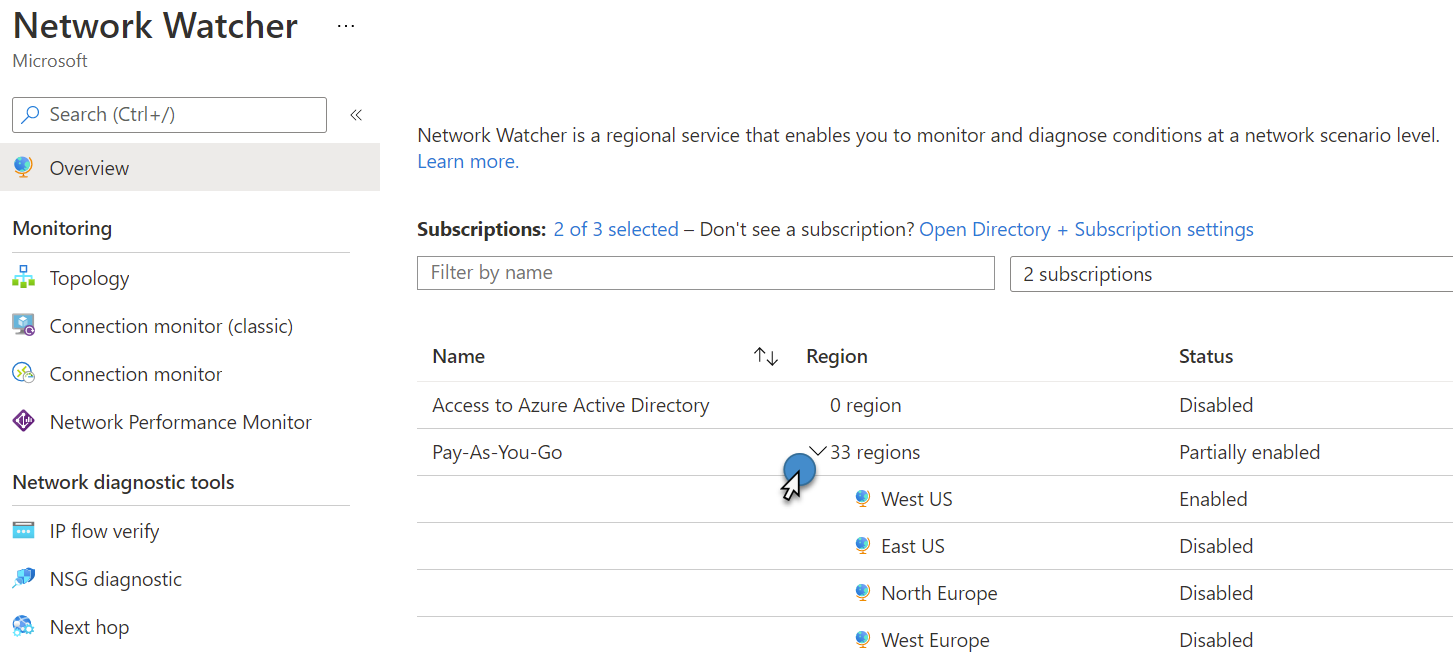
Step 3: Enable Region’s Network Watcher
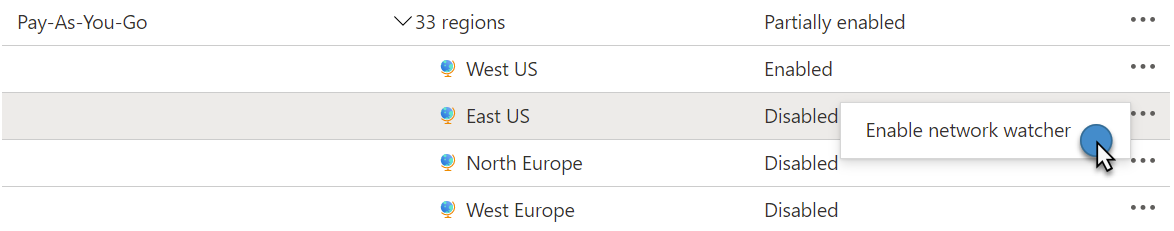
Find the region where you want to enable the Network Watcher and select the More Options ellipses. Select Enable network watcher from the menu.
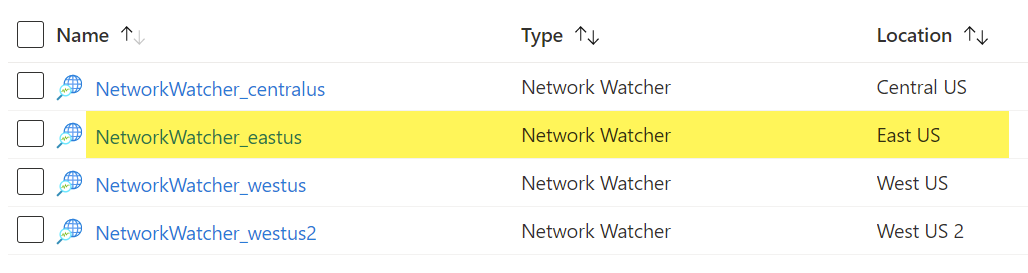
To verify the deployment, navigate back to the NetworkWatcherRG resource group and verify the Network Watcher is deployed for the region.
Enabling Network Watcher using Command Line Tools
If you have a lot of Network Watchers to enable, use the command line to do so. Microsoft provides options in both Azure PowerShell and CLI modules.
Learn how to connect out to Azure AD and other Office 365 modules.
To enable a Network Watcher using PowerShell, use the following command replacing “West US” with the region of your choice.
- New-AzNetworkWatcher -Name "NetworkWatcher_westcentralus" -ResourceGroupName "NetworkWatcherRG" -Location "West Central US"
Use this command in Azure CLI to enable a Network Watcher, again specifying the region you need:
- az network watcher configure --resource-group NetworkWatcherRG --locations westus --enabled
Opt-Out of Network Watcher Automatic Enablement
Microsoft provides two ways to opt-out of Network Watcher automatic enablement. First, you can use Azure PowerShell to disable automatic enablement using the following commands:
- Register-AzProviderFeature -FeatureName DisableNetworkWatcherAutocreation -ProviderNamespace Microsoft.Network
- Register-AzResourceProvider -ProviderNamespace Microsoft.Network
If you prefer the Azure VLI, use the following commands:
- az feature register --name DisableNetworkWatcherAutocreation --namespace Microsoft.Network
- az provider register -n Microsoft.Network
However, Microsoft cautions against disabling automatic enablement as you cannot opt back into automatic enablement without contacting support.
Closing
The Azure Network Watcher is an excellent resource for troubleshooting and diagnosing network problems in your environment. While the resource enablement is free, using the various components does have a cost. Plan accordingly for log maintenance or the number of diagnostics performed to keep costs under control. If you accidentally removed the Network Watcher resource, you now have the tools available to enable it again.
What you should do now
Below are three ways we can help you begin your journey to reducing data risk at your company:
- Schedule a demo session with us, where we can show you around, answer your questions, and help you see if Varonis is right for you.
- Download our free report and learn the risks associated with SaaS data exposure.
- Share this blog post with someone you know who'd enjoy reading it. Share it with them via email, LinkedIn, Reddit, or Facebook.


