
You always want your business-critical production applications to run without issues or downtime. To achieve this you need to continuously analyze system logs, monitor your application and their dependent services to identify and remediate any issues.
What is Azure Monitor?
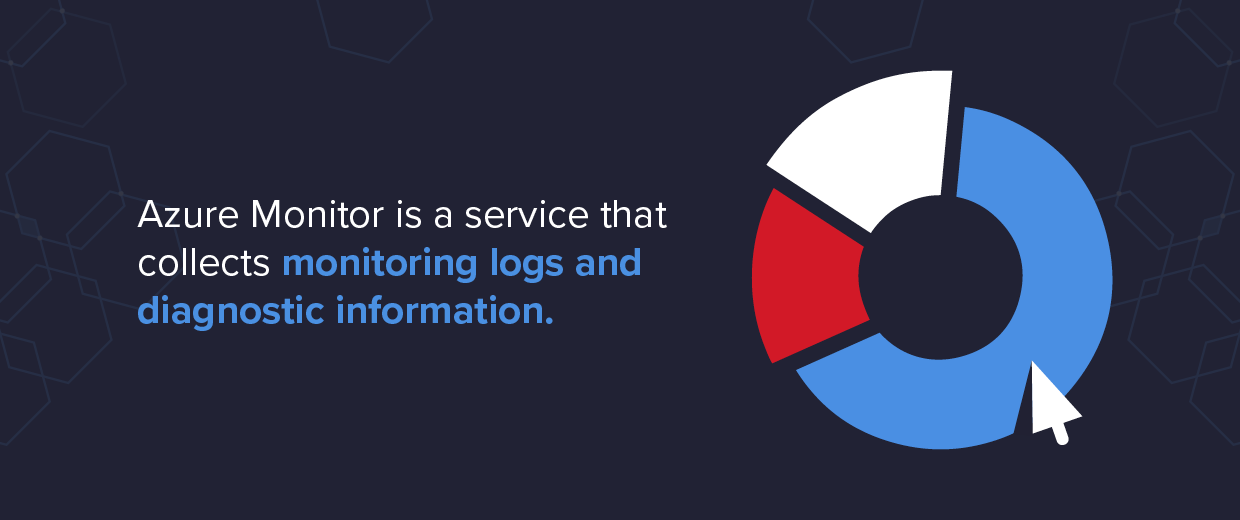
Azure Monitor is a service that collects monitoring logs and diagnostic information. Once collected, monitoring and diagnostic data can then be used to visualize and analyze the health of services and used as a guide to take appropriate action.
Azure Monitor assists in diagnosing the causes of failure and also helps in proactively identifying issues before they actually occur, thereby, improving uptime.
This helps us to gain insight into the performance and availability of our applications within Azure as well as on-premises resources and applications.
Additionally, Azure Monitor can collect resource metrics. Metrics help you understand the performance of your application with respect to the resources it’s consuming.
For example – the CPU utilization, or memory utilization, etc. If we talk about the logs, they are captured when there is a change in the resource. For example – when they are modified, created, in case there are issues, failures, etc.
Azure Monitor Features
Below is the diagram, which gives a high-level view of Azure Monitor, along with its features, capabilities, and usage. This diagram is divided into two sections. The bottom part of the diagram shows the sources for Azure Monitor. These are applications, operating system, azure resources, subscription, and tenant, as well as other custom sources.
The top section of the diagram is Azure Monitor, where we first have the data stores for metrics and logs, and then this data is consumed by different functions and services.
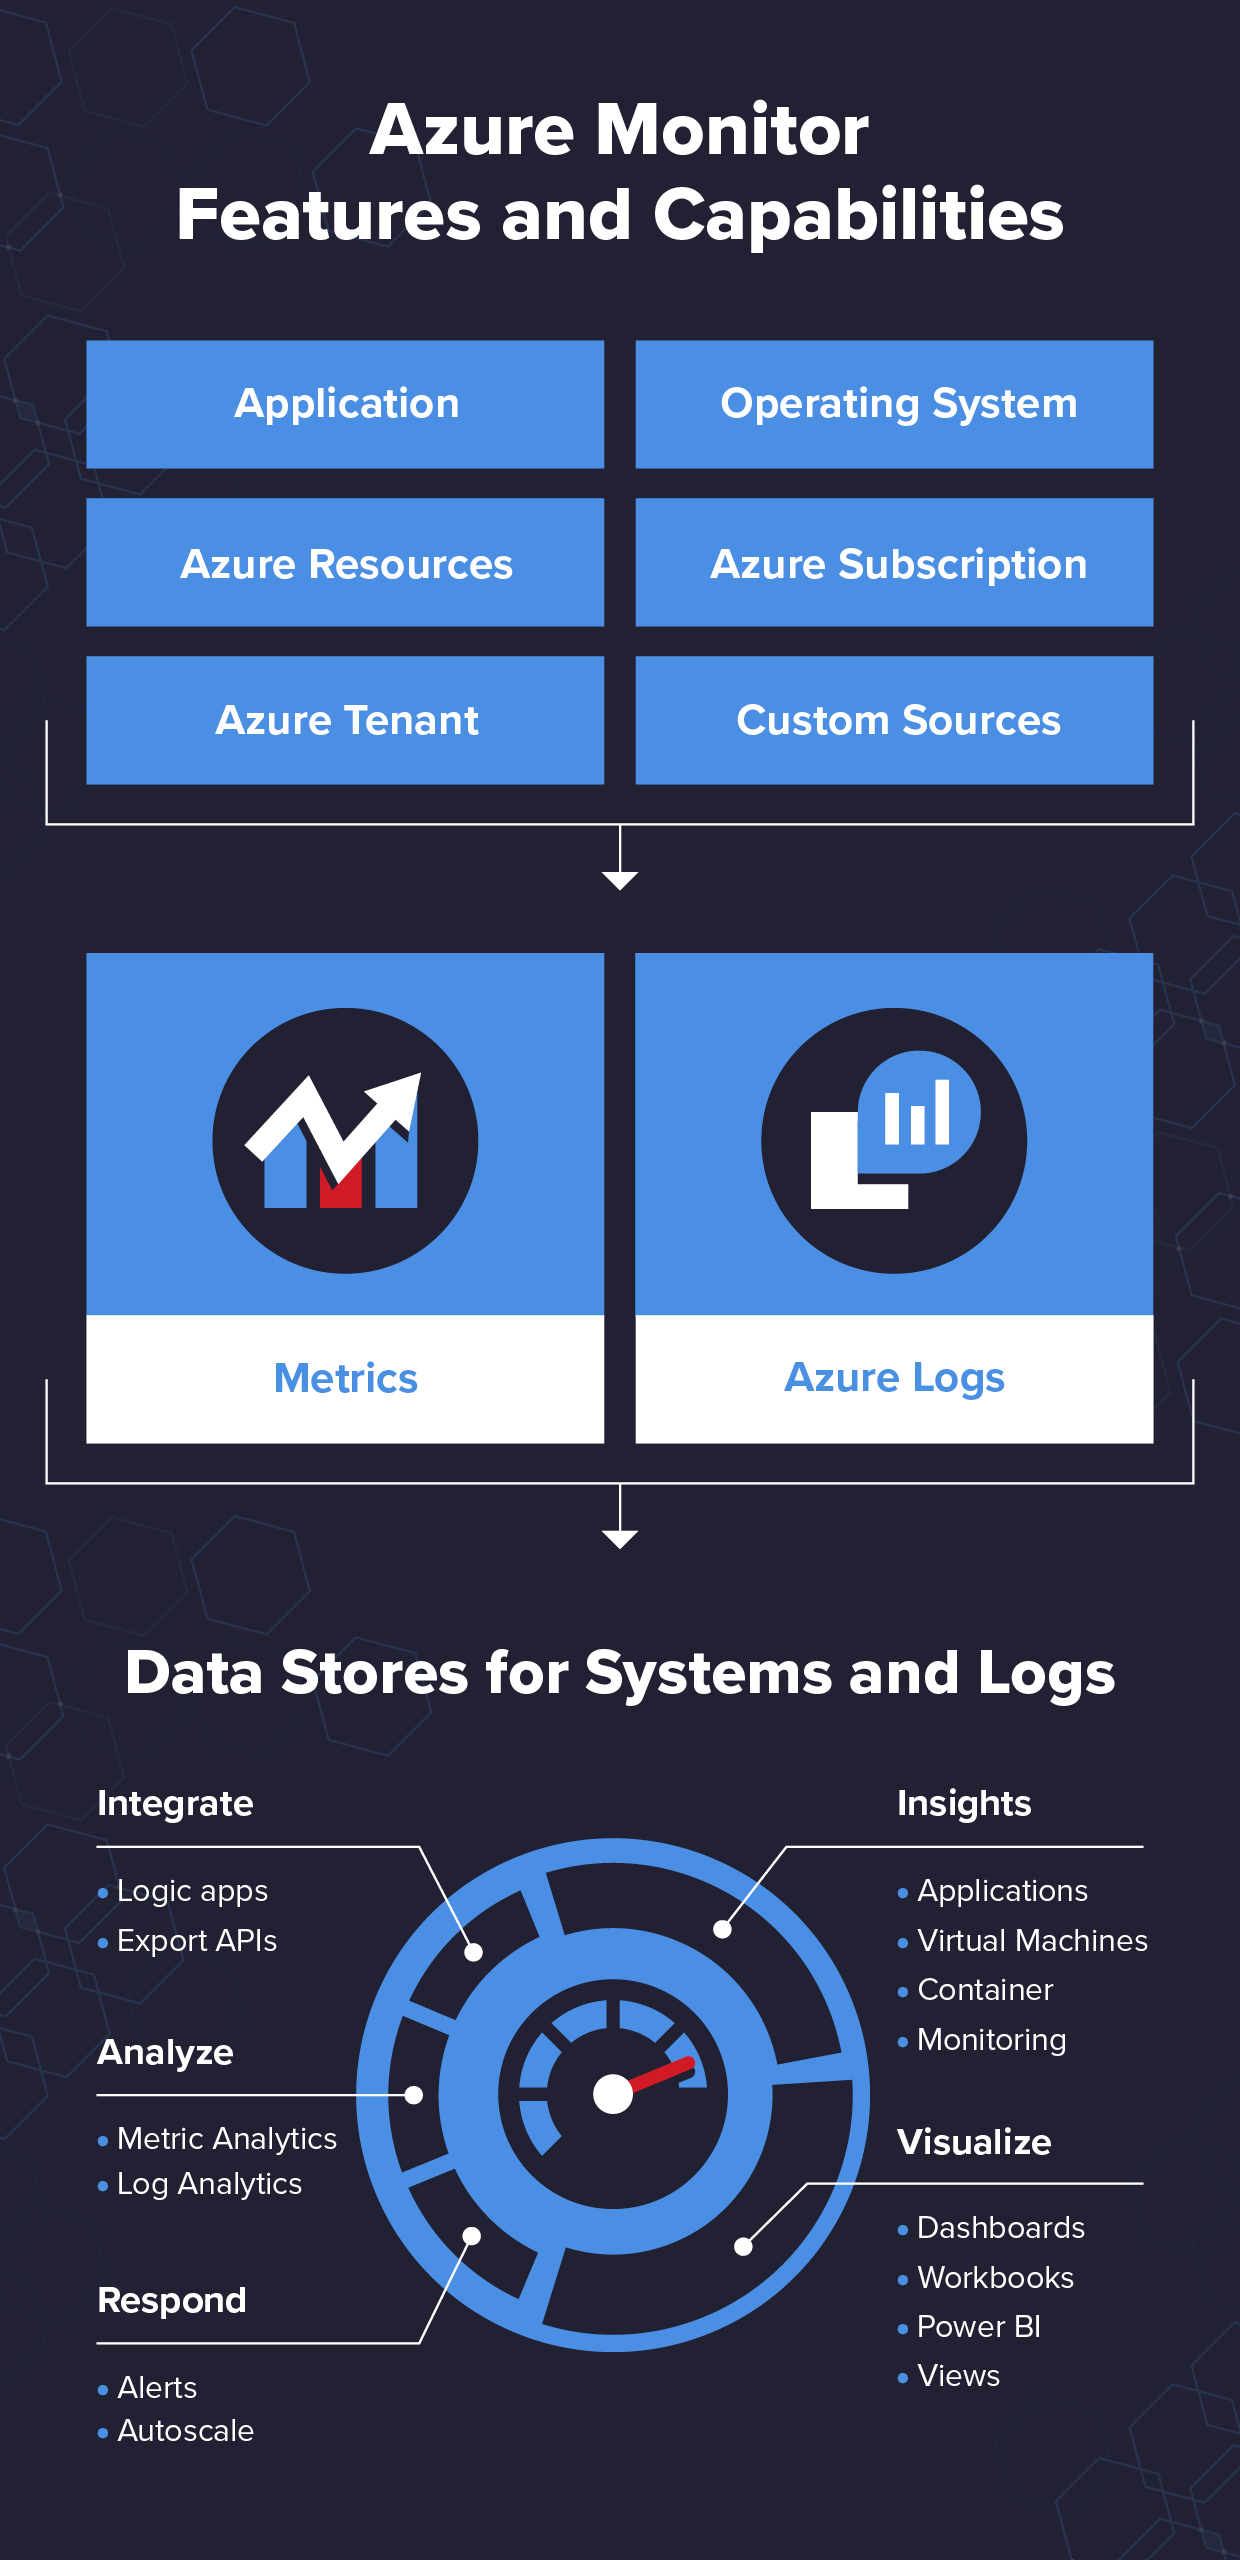
Let’s begin with the top part of the application:
- Application data: Data that relates to your custom application code.
- Operating system data: Data from the Windows or Linux virtual machines that host your application.
- Azure resource data: Data that relates to the operations of an Azure resource, such as a web app or a load balancer.
- Azure subscription data: Data that relates to your subscription. It includes data about Azure health and availability.
- Azure tenant data: Data about your Azure organization-level services, such as Azure Active Directory.
On the bottom, we have the Azure Monitor, which has the following features:
- Integrate with Logic apps or use the Export APIs to perform specific actions
- Analyze the data using Metric Analytics or Log Analytics, for which we can use the Kusto Query Language or the KQL.
Kusto is a query language and abbreviated as (KQL) was developed with certain key principles in mind, like – easy to read and understand syntax, provide high-performance through scaling, and the one that can transition smoothly from simple to complex queries.
Interestingly the KQL is a read-only query language, which processes the data and returns results. It is very similar to SQL with a sequence of statements, where the statements are modeled as a flow of tabular data output from the previous statement to the next statement. These statements are concatenated with a pipe (|) character. We will talk more about it and see it in action when working with the demo: - Respond to critical situations by sending the alerts and set up rules for auto-scaling to respond to the changing computational needs.
- Insights can be used by the applications, VMs, including containers and monitoring solutions to capture in-depth details on how they are performing and then relay the same to analyze and respond appropriately
- Visualize the data using dashboards, excel workbooks, Power BI, or by creating views. These help in understanding the current state and let you plan actions accordingly.
The data collected by Azure Monitor can be extended by enabling diagnostics, where you get the full information after you have enabled it. Also, for virtual machines, you install the agents to send the data to the Log Analytics workspace.
Azure Monitor: Logs and Metrics
Let us spend some more time to understand what logs are and what metrics are.
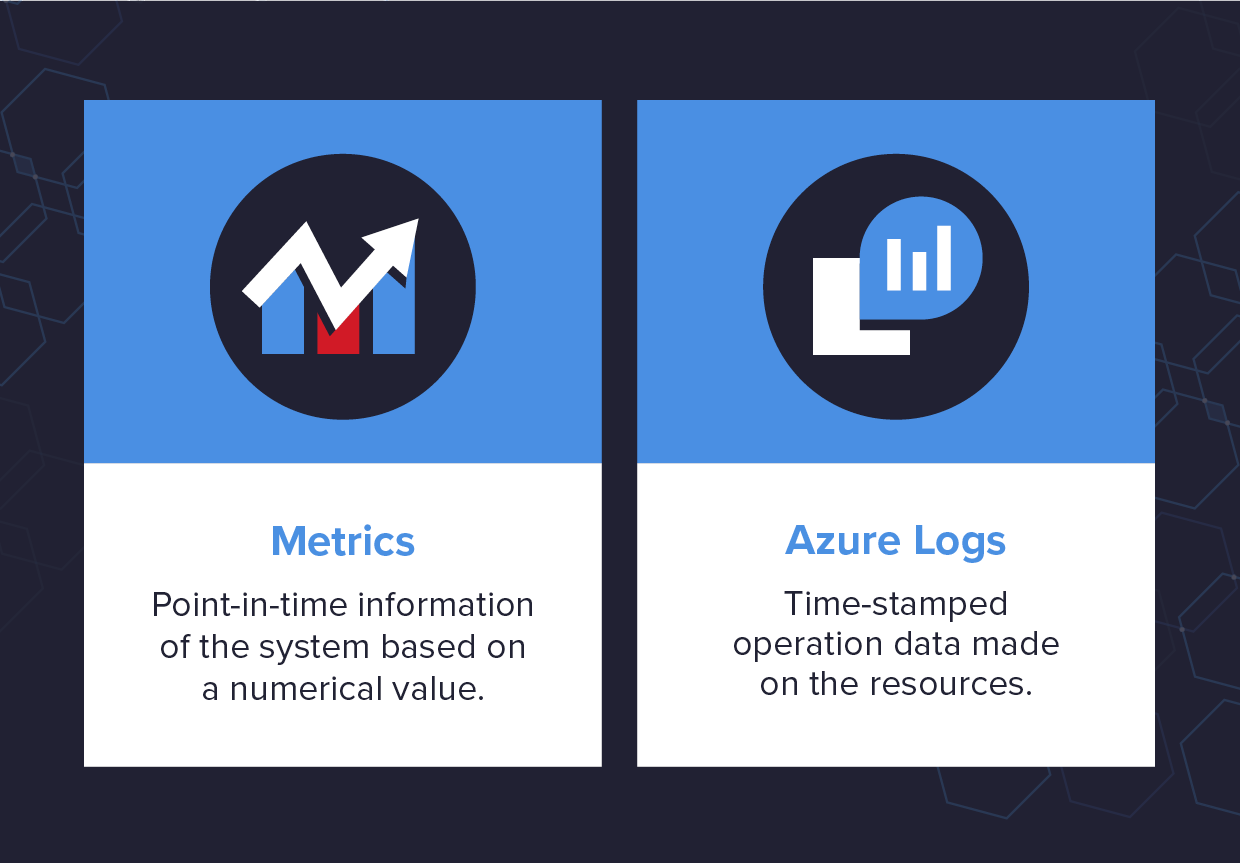
Logs contain time-stamped information about changes made to resources. We know that the events can occur sporadically or at fixed intervals and also depend on the source, where the event is occurring. These events can be from the applications and services, which provide the context for the events and these logs are organized into records. It may include metrics data, which is numerical, but mostly it is text data.
As I said, you can store metric data in logs to combine them with other monitoring data for analysis. These logs show the context of any issue and help in identifying the root causes of the problems.
Metrics are point-in-time information of a system based on a numerical value. Azure Monitor does frequent sampling of the source and captures metrics in near real-time. They are useful for alerting and take appropriate actions as and when needed. One such example is the scaling of services or servers based on CPU and memory utilization. Metrics are stored in a time-series database, which is most effective for analyzing time-stamped data.
We use the Kusto Query Language to extract information from log data and examine the data that Azure Monitor captures. Kusto Query Language (KQL) is case-sensitive. Language keywords are typically written in lowercase. When you’re using the names of tables or columns in a query, make sure to use the correct case.
There are certain demo platforms that are provided by Microsoft, which can be used free of cost for practice purposes. They are for:
- Log Analytics (https://aka.ms/LADemo)
- Application Insights (https://aka.ms/AIAnalyticsDemo)
- Windows Defender Advanced Threat Protection (https://aka.ms/WinDefATP)
These platforms also have saved queries that can be used to get an insight into how queries are formed and complex queries can be built. You can save your queries as well for later use.
Create and Configuring Azure Monitor
Now that we clearly understand what Azure Monitor is and its features and capabilities, it is the perfect time to dive into the demo. In the following demo, we will configure the Azure Monitor service to monitor an App Services Web App. App Services Web App is a PaaS offering, which runs on Microsoft Azure infrastructure managed by Microsoft themselves. Azure Monitor should be able to trigger an action when the average CPU utilization of the server that hosts the Web App goes above the set threshold level. To learn more about the App Services, click here.
Prerequisites
Before we get started, below are the prerequisites needed for you to complete the demo.
- Azure Subscription (https://portal.azure.com)
- App Service Web App – You can follow the instructions provided here to create and publish an ASP.Net Web App to Azure App Services
Below steps will be followed to configure Azure Monitor service to monitor the Web App.
- Configure the Azure Monitor Service
- Create Condition and Action group
- Create the Alert rule for CPU Time
- Manage permissions for Azure Monitor
Configure Metrics for App Services WebApp
The first step is to create the Azure Monitor service, follow the steps as mentioned below.
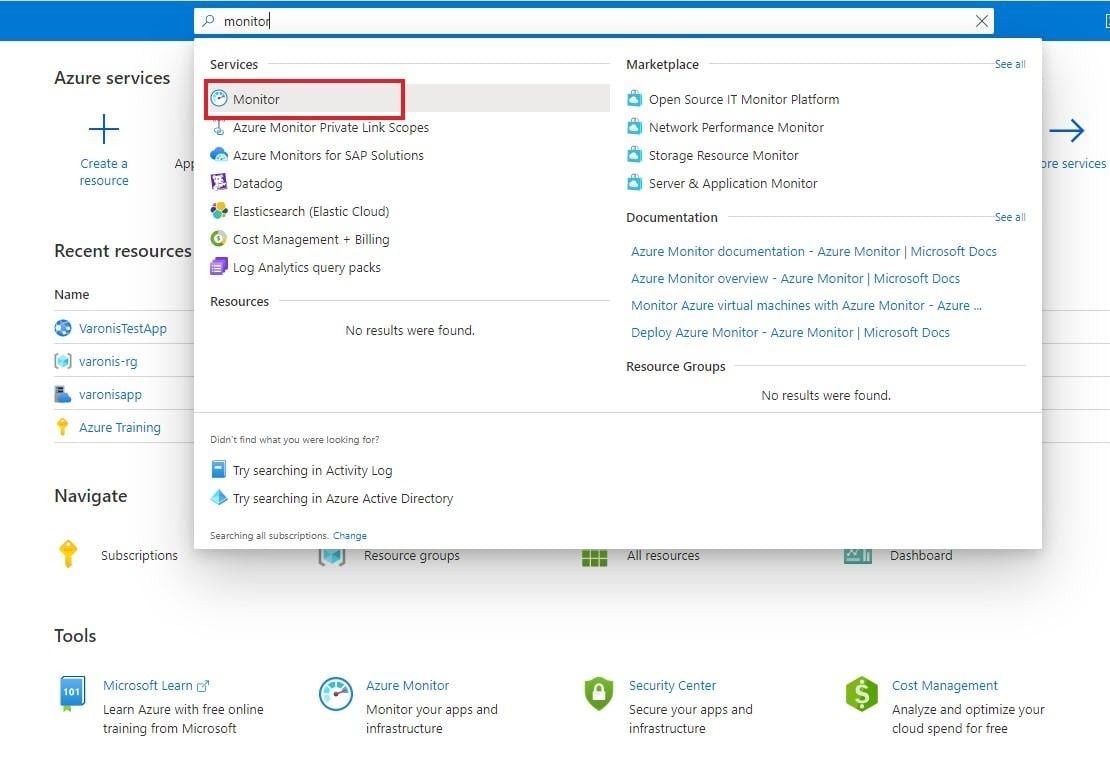
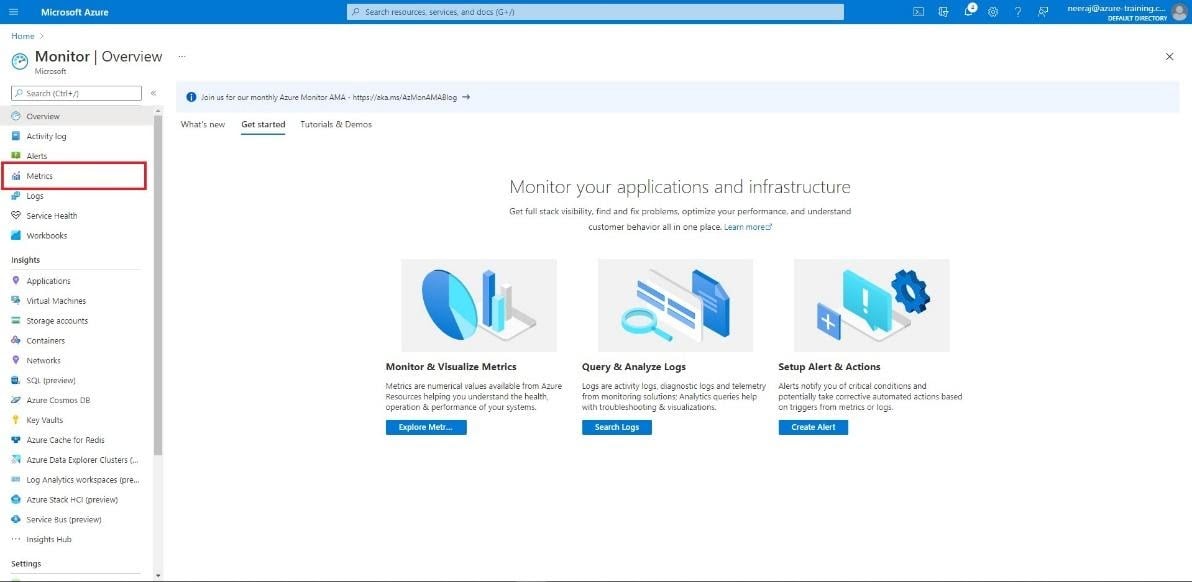
- On the Azure portal, click on the search bar and search for Monitor
- From the results dropdown that appears, click and select Monitor

- Once you are on the Azure Monitor page, you will see a dashboard to help you get started with the configuration. Click on the Metrics link from the left-hand menu.

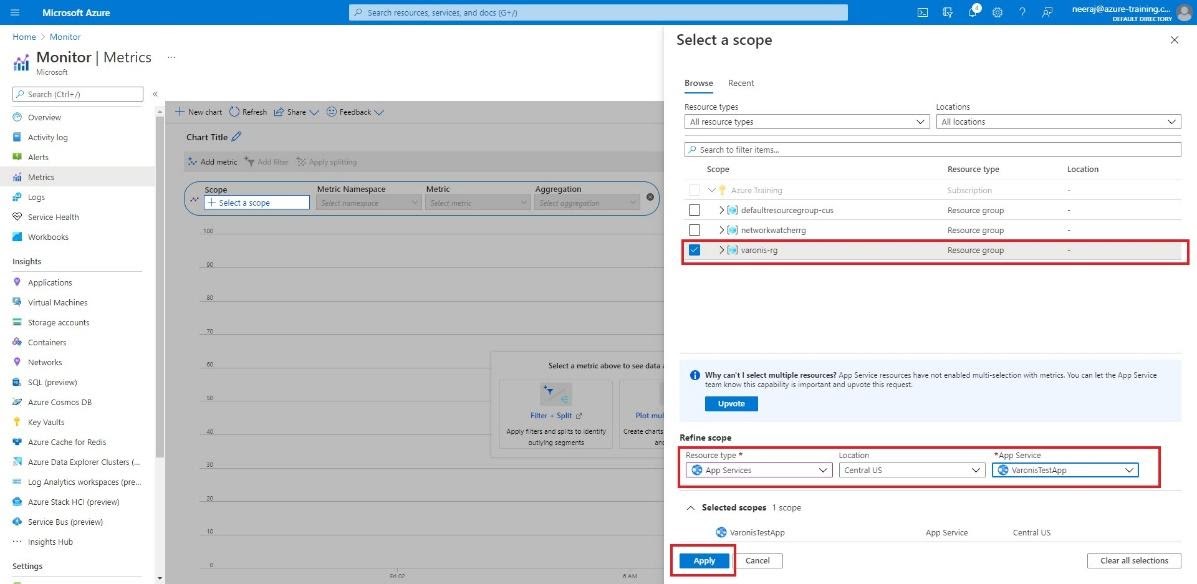
- After you click on Metrics, it will open the page where you have to choose the resource group and the resource to monitor.
- Choose the resource group from Select a scope page
- After you choose the Resource Group, choose the Resource type, and accordingly choose the service under Refine Scope. In our case, we have to choose the App Services under Resource type and the Web App name under App Services

- Click on Apply after all the selections have been made.
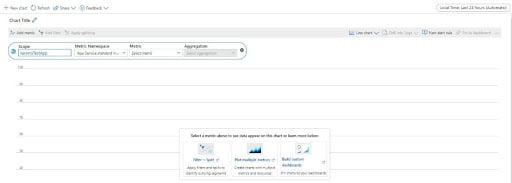
- You will be redirected to the page where you can create charts based on the metric that you choose. If you notice here, you will see that by default the Scope is selected as VaronisTestApp, and the Metric Namespace is App Service standard metrics. We can select the desired Metric and Aggregation to create a new chart

- From the Metric dropdown, select CPU Time
- From the Aggregation dropdown select Sum
Create Condition and Action Rule for CPU Time
After the selections have been made, you can create a New alert rule. Follow the steps below to create a new alert rule.
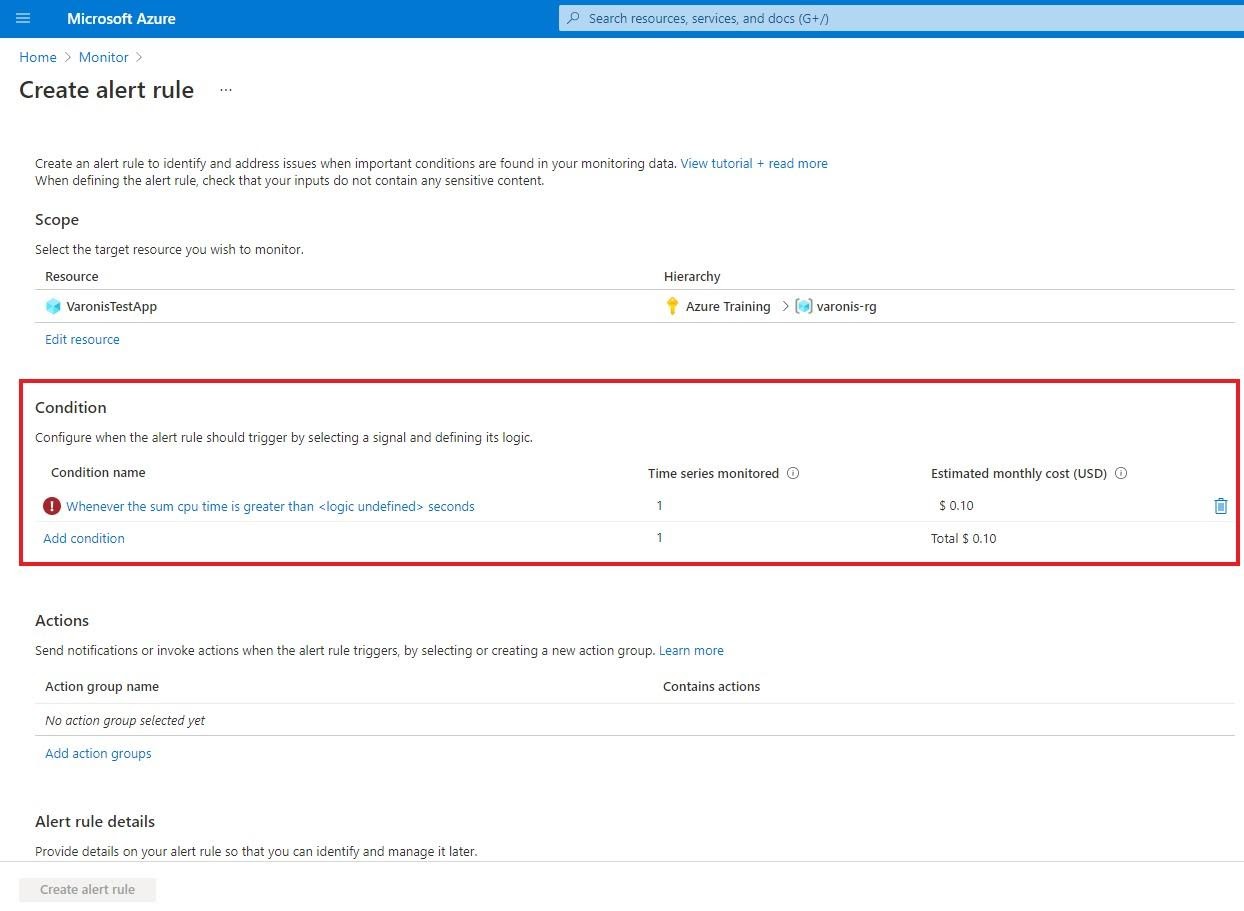
- Select New alert rule from the right navigation menu

- The Create alert rule page opens, where the scope is by default selected for you as per our previous selection. You will see that the Condition shows an error because no logic has been defined yet.

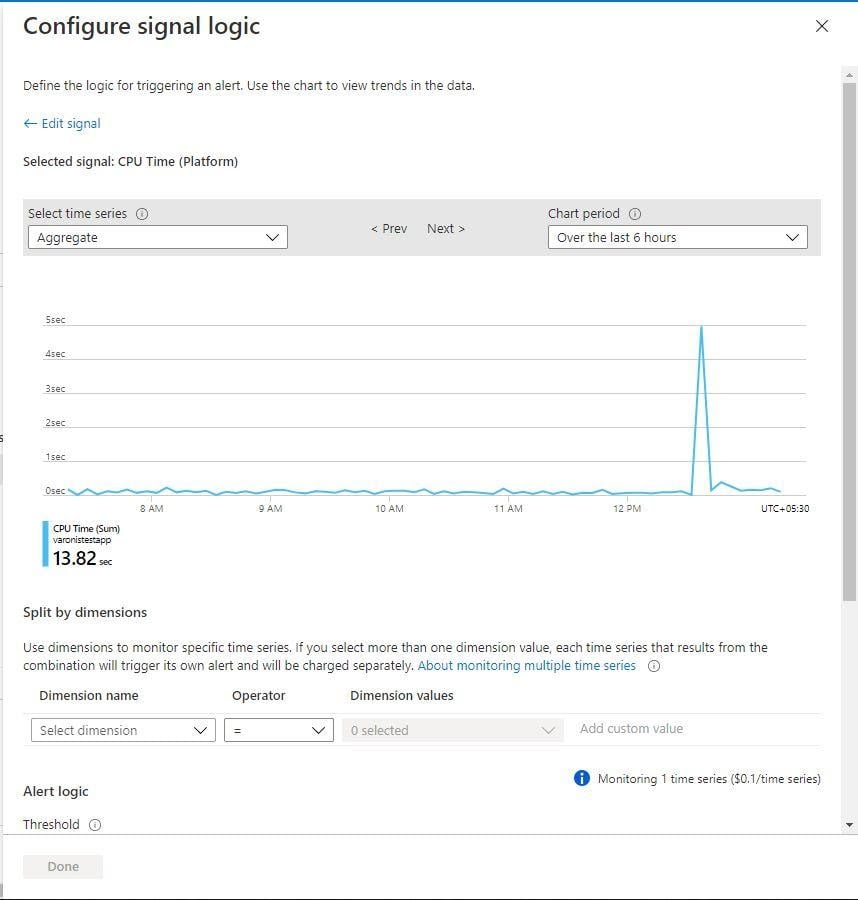
- Click on the link “Whenever the sum cpu time is greater than <logic undefined> seconds”, which will open the page to Configure signal logic

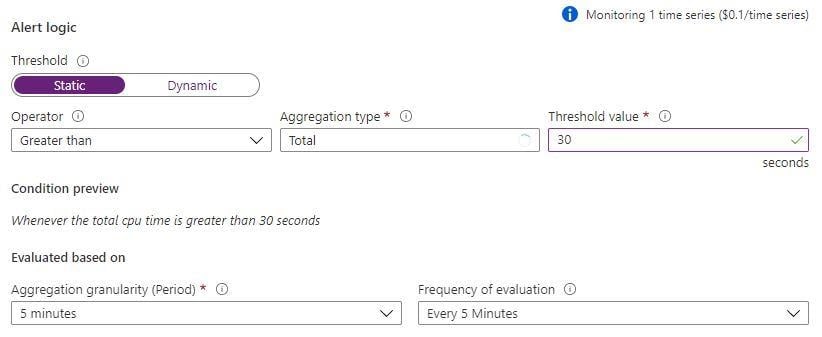
- Scroll down to the Alert logic and from the Threshold, let the selection remain at Static
- From the Aggregation type, select Total
- Under the Threshold value, enter 30 from the time in seconds.

- After the selection have been done, click on the Done button
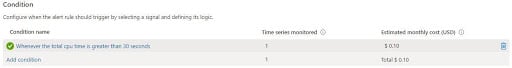
- You will now see a green checkmark under condition and the condition name shows the condition defined

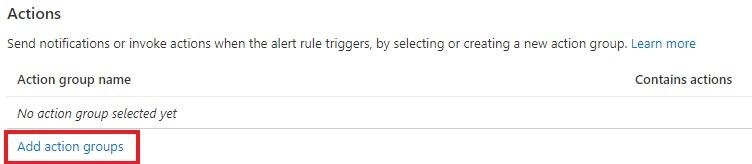
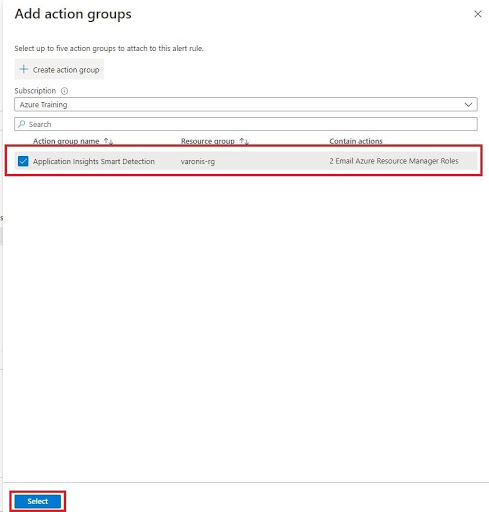
- Scroll down the page and under Actions, click on Add action groups

- On the popup that opens, you will see the Action group already created with the actions. It has the name of Application Insights Smart Detection and has the action set as 2 Email Azure Resource Manager Roles under Contain actions
- Check the box to select the Action group and then click on the Select button

Create the Alert Rule for CPU Time
Now that the Action has been defined, it is finally time to create the alert rule. Proceed with the below steps to create the Alert Rule.
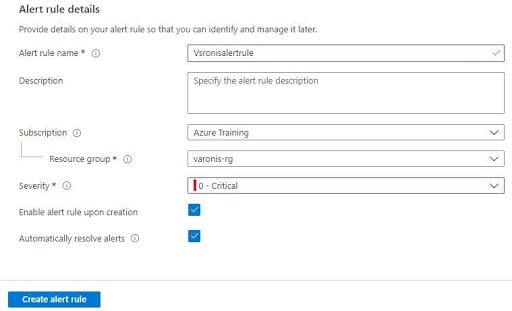
- Provide the Alert rule name
- The Subscription and Resource group will be preselected for you in case you have only one subscription and resource group. In case you have multiple subscriptions or resource groups within the subscriptions, select accordingly.
- Select “0-Critical” under Severity
- Let the checkbox remain selected for Enable alert rule upon creation and Automatically resolve alerts

- Finally, click on the Create alert rule button

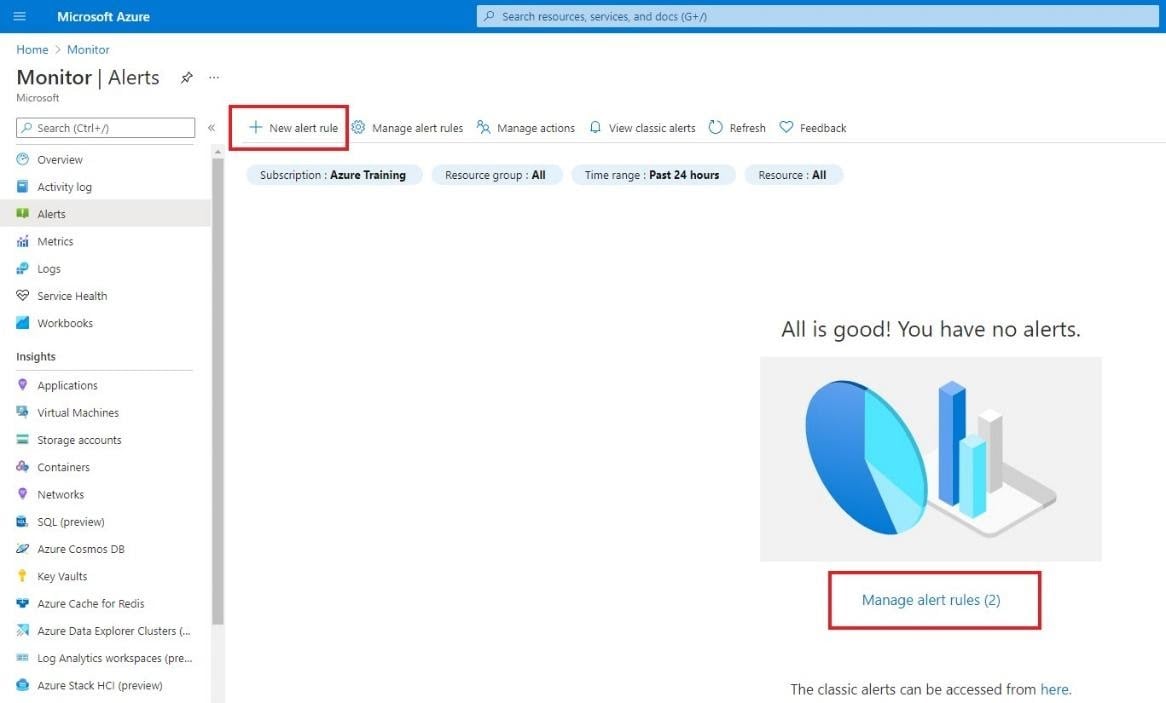
Alert rules can also be created by clicking Alerts from the left-hand menu.
You can click on the New alert rule button from the top navigation to create the new rule. Notice that the screen above shows Manage alert rules(2), which is indicative of the rules that we had created earlier. You can click on the link to open the rules defined earlier.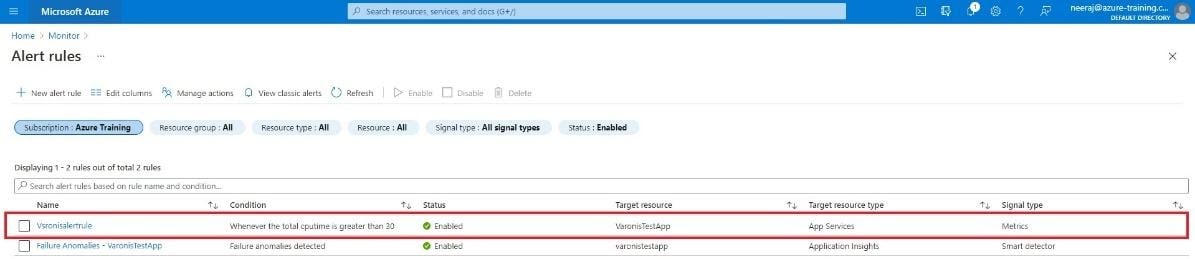
One of the rules is created by default (Failure Anomalies – VaronisTestApp). You can click on the rule name to modify/update the rule created earlier.
Manage Permissions for Azure Monitor
While adding the Action group, we created the action to send email to the Azure Resource Manager Roles: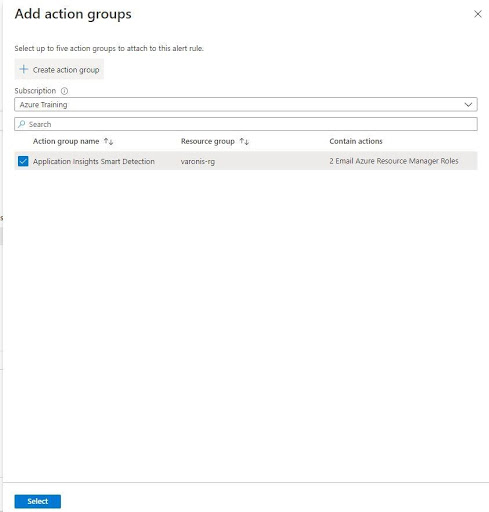
We need to check if the emails will be triggered to the proper Azure roles. For the emails to be triggered, the organizational ids must have the Monitoring Contributor role.
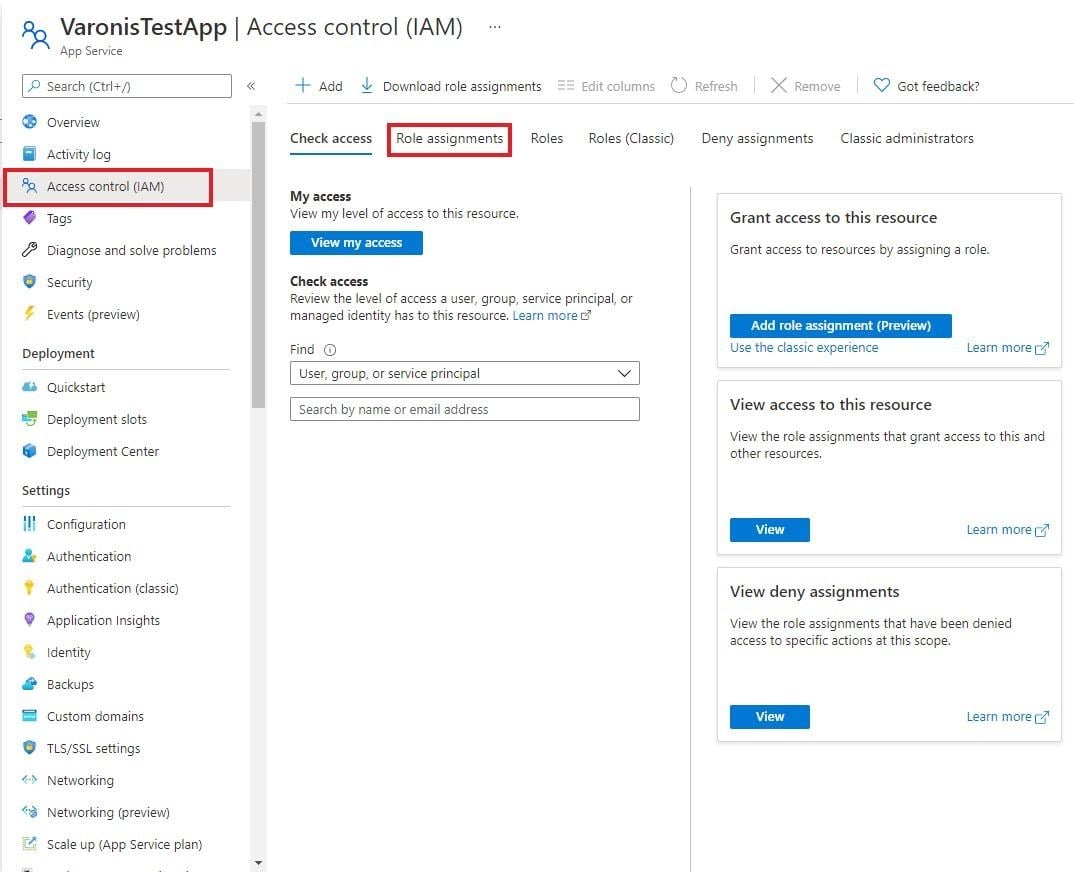
- Go to the App Services Web App created earlier for which the monitoring has been enabled.
- Click on Access Control (IAM) from the left-hand menu.

- On the Role Assignments page, click on Add
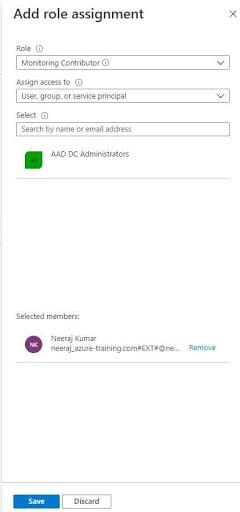
- On the popup page that opens, select the Role as Monitoring Contributor
- Under Select, the id to which the permission needs to be given

- Click on the Save button
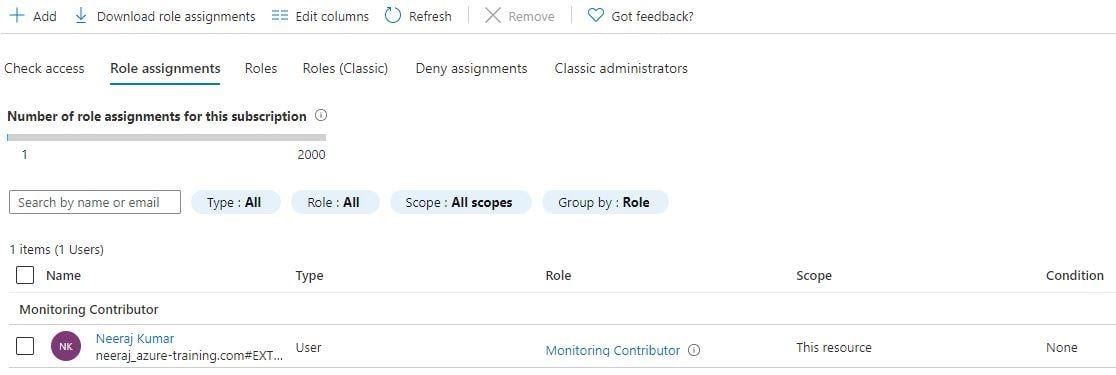
- The newly added role and identity now appears under Role Assignments
 Once added, this identity will be able to receive emails when Azure Monitor triggers alerts.
Summary
Azure Monitor is one such tool that can be used to monitor your Azure workloads. It logs the metrics and diagnostics data into Azure Monitor logs that can be used to analyze the telemetry in order to help us understand how the resource is performing. The best part about Azure Monitor is that it can be used to monitor both Azure resources as well as on-premise workloads and services. Also, it automatically starts working as soon as the resource (s) is (are) provisioned. The data captured can be visualized using dashboards, excel workbooks, Power BI tools, or by creating views as well. As an Azure architect or Azure administrator, Azure Monitor is an essential tool for insight into your workloads.


-1.png)