When responding to a cybersecurity incident I’ve always found memory forensics to be a great skill to have. By capturing the memory of a compromised device you can quickly perform some analysis to identify potential malware and gather IOC’s which can then be used to identify other compromised devices.
In this article, I will cover the following topics:
- Provide an overview of what memory forensics is
- Explain what volatile data is and why it is relevant to memory forensics
- Explain what a memory/RAM dump is
- Outline the benefits of memory analysis
- Give an overview of some popular tools that can be used for memory analysis
Memory Forensics Overview

Memory forensics is the process of capturing the running memory of a device and then analyzing the captured output for evidence of malicious software. Unlike hard-disk forensics where the file system of a device is cloned and every file on the disk can be recovered and analyzed, memory forensics focuses on the actual programs that were running on a device when the memory dump was captured.
The memory of a device is known as Random Access Memory (RAM), so when purchasing a new laptop, as part of the specification you will see the size of the hard disk i.e. 1TB, and the amount of RAM i.e. 16GB.
When an application is opened on a device, a certain amount of RAM will be allocated to that application so it can run, if applications are opened then more RAM will need to be allocated by the device. This is why devices with larger RAM are faster as they can run more applications at the same time.
Get the Free Pentesting Active
Directory Environments E-Book
What is Volatile Data?
Volatile data is something that any incident responder needs to be aware of, the reason being is that when dealing with a compromised device one of the first reactions may be to turn the device off to contain the threat.
The problem with this approach is that any malware that is running on the device will be running in memory. So any network connections and running processes will be lost, this is because the malware has been running in memory and this data is now lost. This volatile data is not written to disk and is changing constantly in memory, so powering down the device means valuable evidence has been destroyed.
Network containment (isolating the device from the rest of the network) is the preferred option when isolating a compromised device. This method will securely contain the incident and also preserve valuable evidence and not destroy the volatile data in memory.
What is a Memory Dump?
A memory dump or RAM dump is a snapshot of memory that has been captured for memory analysis. When a RAM dump is captured it will contain data relating to any running processes at the time the capture was taken.
Benefits of Using Memory Forensics for Incident Response
Responding to a cybersecurity incident isn’t always a straightforward affair. Perhaps the server that has been compromised may not be feeding logs into a SIEM, there may even be no logging at all! So as part of an incident response plan how can you begin to investigate the device and start gathering evidence in a timely manner?
You need to first confirm that there is malware on the device before you can capture a sample and begin reverse-engineering the malware with specialist tools.
Taking an image of a device can be time-consuming, and you then have the issue of transferring the image which could be 100GB in size, to a location where it can be analyzed. Then you have to take into consideration how long the analysis will take by the IR team.
This is where memory analysis can be a big win for the IR team. Whereas a server hard drive may be over 100GB in size, the RAM of the device will be a lot smaller, typically 16GB – 32GB. This means that capturing a RAM dump from a device will be a lot quicker and smaller in size when transferring the output.
By prioritizing RAM over a hard disk image when triaging an incident you can begin analysing the RAM dump for IOCs (Indicators of Compromise) while you begin working on getting an image of the hard drive.
How to capture RAM for analysis
If you are responding to an incident and require a RAM dump then how you will go about capturing that data will differ depending on if the device is a physical or virtual machine
Capturing RAM from a physical device
Capturing the RAM from a physical device can be done using several tools, however, one I have often used in the past which I have found very reliable and easy to use is WinPmem.
From the link above you can download either a 64-bit or 32-bit version of WinPmem. Once the correct version has been downloaded open up a command prompt with admin privileges and navigate to the location on the disk where the executable has been downloaded.
Tip: When capturing memory from a device run the tool you are performing the memory dump from a USB device where possible and dump the output to a network share
In the example below I have saved WinPMem to my downloads folder.
To begin a memory capture use the following syntax to create a raw output file.
winpmem_mini_x64.exe <filename>.raw
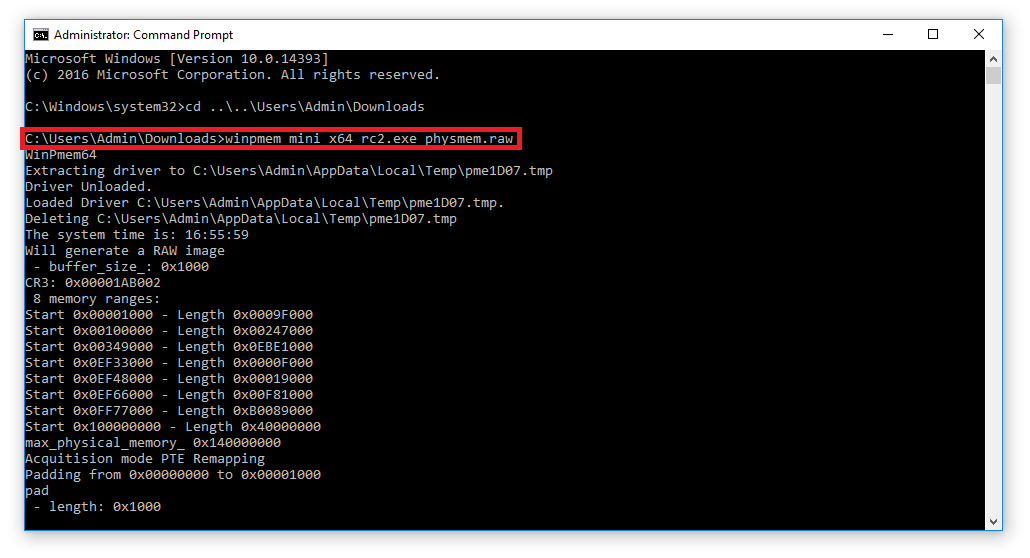
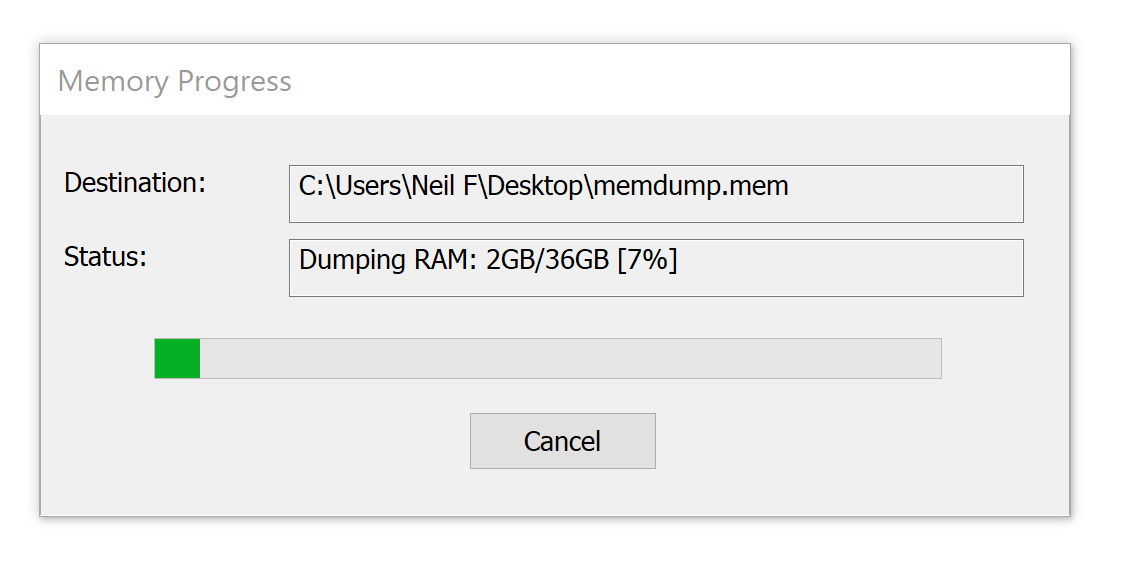
In the image above I have named the output file as ‘physmem.raw’. WinPMem will then display the progress as the RAM is captured.
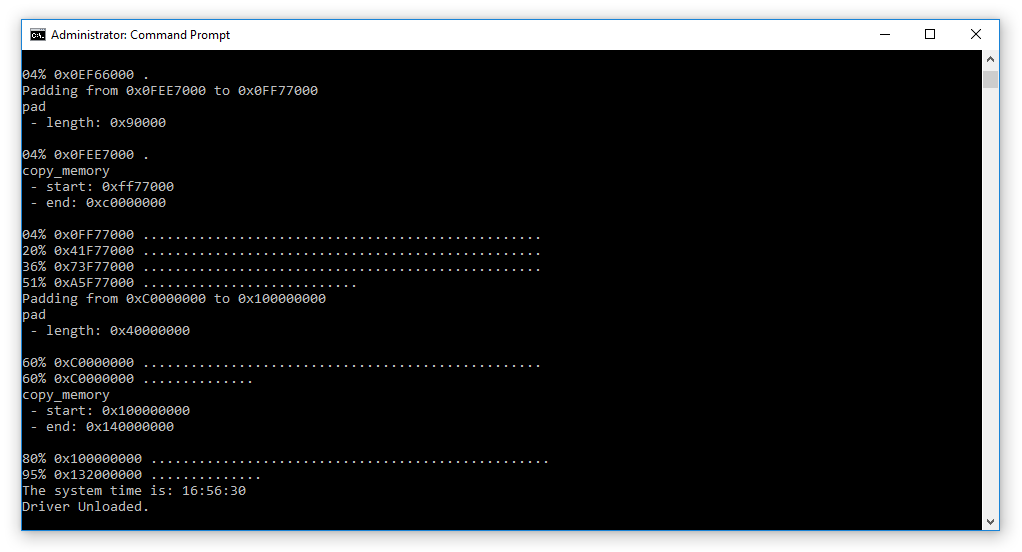
A file called physmem.raw has now been created which is the captured memory of the device.
FTK Imager is another tool I also like to use for capturing RAM dumps. Once it has been installed select ‘File’ then ‘Capture Memory’.
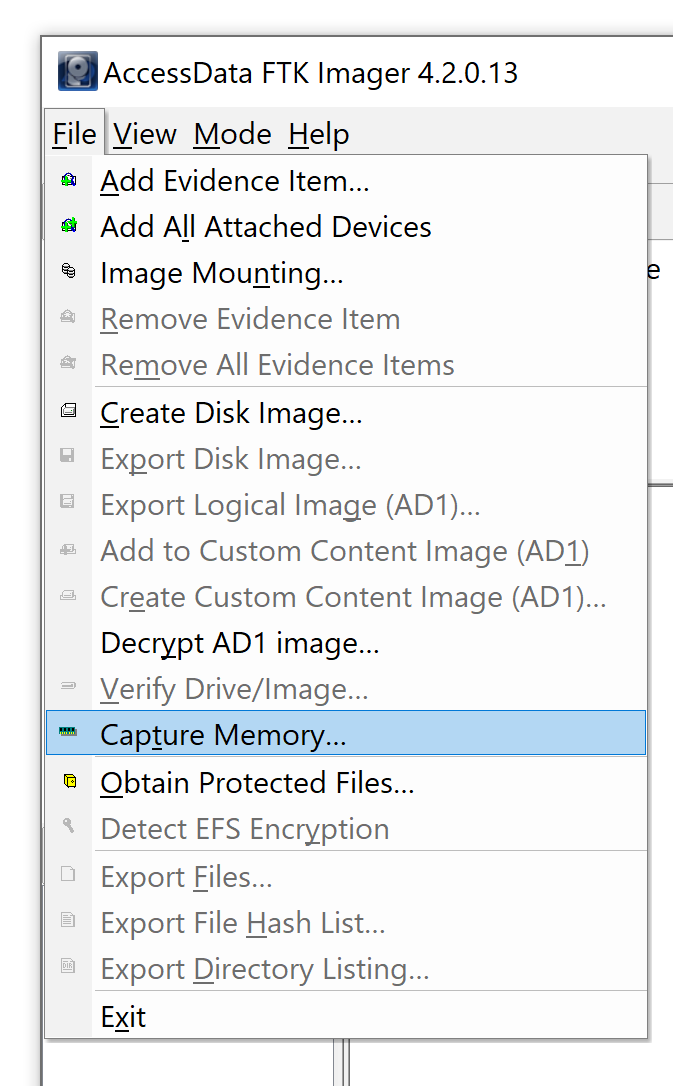
Choose a location where you would like to save the output by selecting ‘Browse’ and then select ‘Capture Memory’.
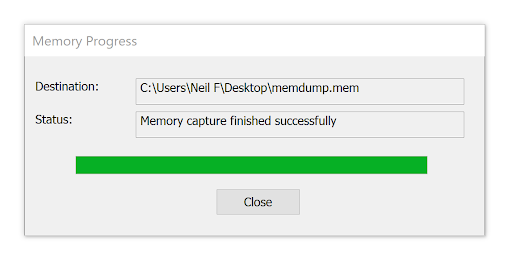
FTK Imager will then display the progress of the memory capture process.
The status will then update to confirm the memory capture has been completed and the output will be saved to the chosen location.
Capturing RAM from a virtual machine
Capturing memory from a virtual machine is easy which is great news when you are responding to an incident where time is a factor.
Taking a snapshot of a virtual machine will create a vmem file, these can then be analyzed using a tool such as Volatility.
Memory Forensics Tools
Below I’ve listed some of the tools I have previously used for memory analysis and the good news is that they are all free!
Volatility
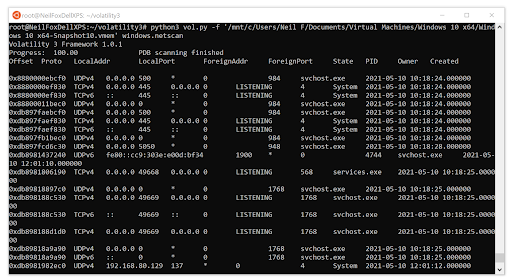
Volatility is my tool of choice for memory analysis and is available for Windows and Linux. Volatility is a command-line tool that allows you to quickly pull out useful information such as what processes were running on the device, network connections, and processes that contained injected code. You can even dump DLL’s and processes for further analysis.
Volatility also supports the analysis of memory dumps from Unix devices and a wide range of plugins have been designed by the forensic community.
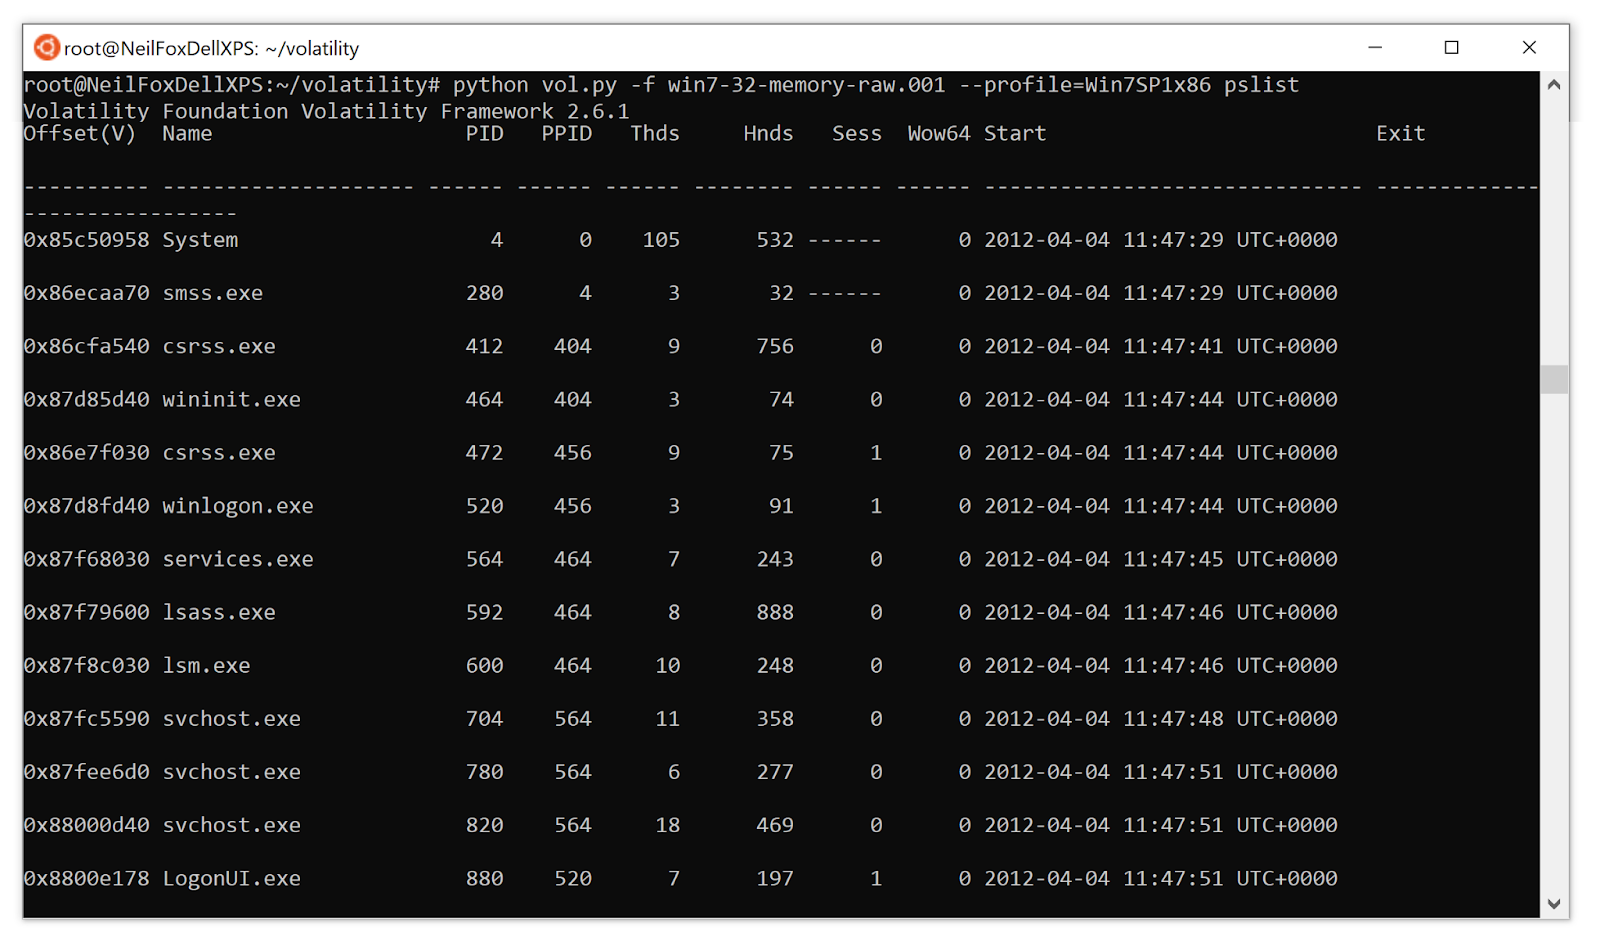 One issue with Volatility was it required setting a ‘profile’ that matched the operating system of the device it was captured from for the tool to work. However, this has now been addressed in Volaitlity3 and the setting of a profile is no longer required making using the tool even easier.
The image below shows how Volatility can be used to analyse a vmem file and also how no operating system profile needs to be declared.
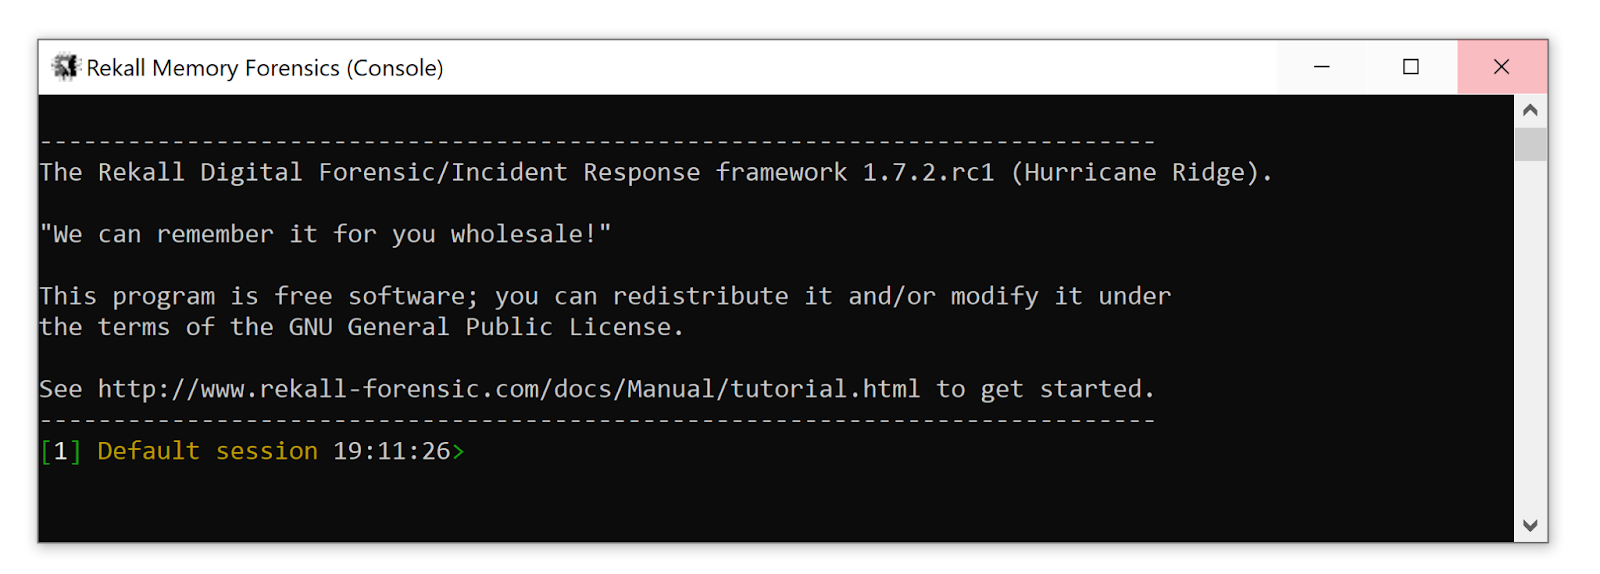
Rekall
Rekall is similar to Volatility as it is another command-line tool, which one you use comes down to personal preference.
Redline
Redline is a memory analysis tool that unlike Volatility and Rekall is strictly a GUI-driven tool, a downside to using Redline is that it only supports analysis of Windows devices.
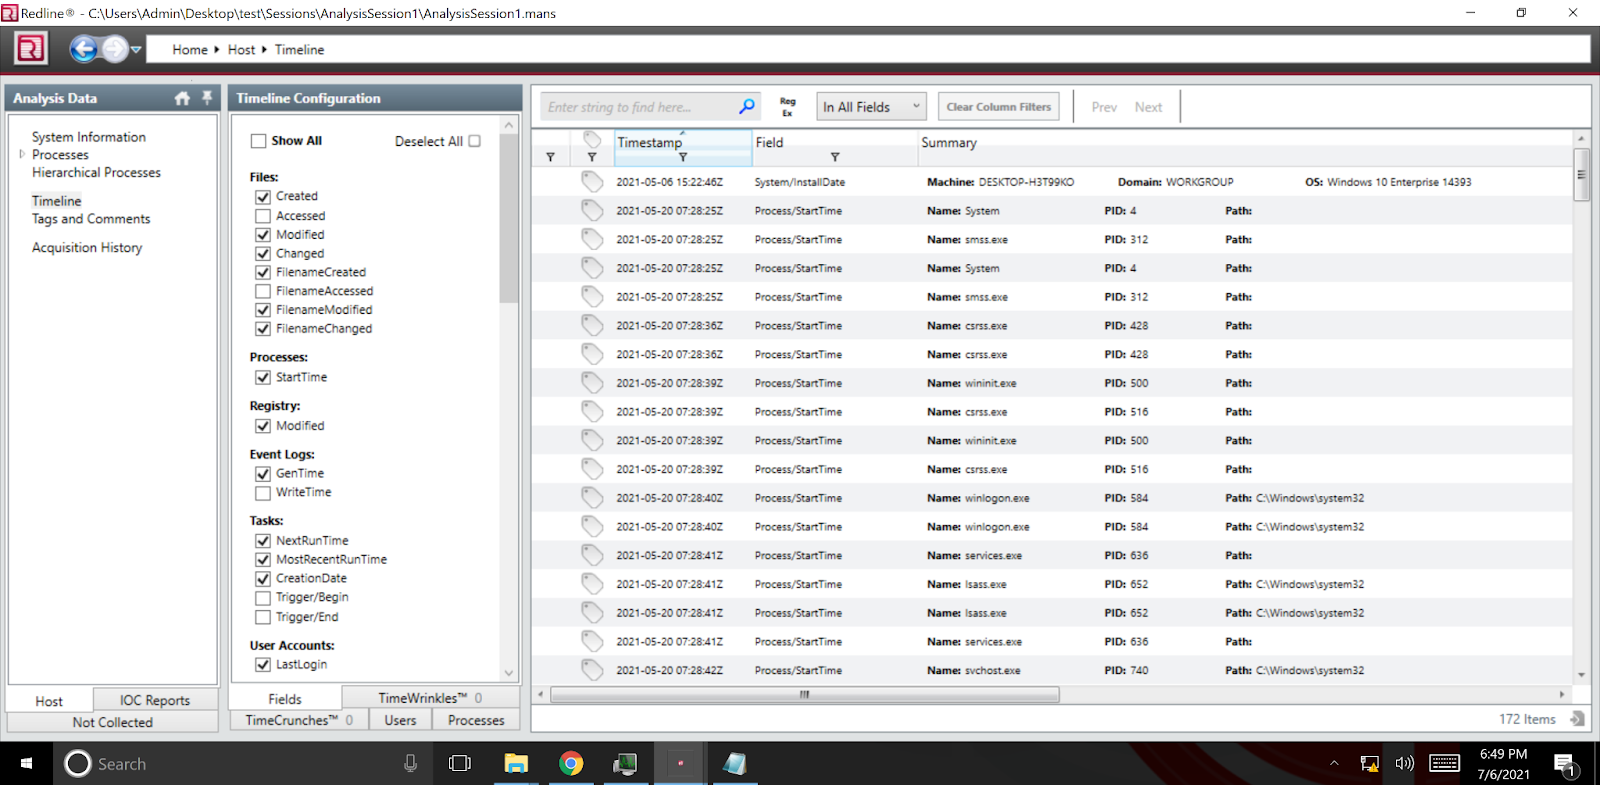
The image below shows how easy it is to filter on specific processes to make memory analysis a lot easier and more accessible.
What Should I Look For In a Memory Dump?
One saying that always stuck with me is ‘malware can hide, but it must run’. Malware will try and hide in places a user may not navigate, however when it runs there will be a process running on the device for the malware. So based on this the easiest way to look for malware is to take a close look at the running processes on a device.
Look for process names that you don’t recognize by looking at process listings, when you google them do they turn up any results?
Looking at process trees is another great starting point, look at what processes have been created and what the parent processes are. Is this activity you would expect to see?
One great tip is to look at processes with legitimate Windows names such as ‘svchost.exe’, windows system processes will always have set parent processes and run locations. If you find a process running from an unexpected location then it may be worth investigating.
This poster from SANs on how to ‘hunt evil’ is a great resource that will help identify any malicious processes.
Check the network connections, are there any unusual ports that are being connected to? Look for what’s known as ‘poker hands’, this is where the attackers have set ports that have all the same numbers such as ‘4444’ or increment such as ‘1234’.
Final Thoughts
This blog post should illustrate how memory forensics can be a great tool to have in your incident response arsenal. Speaking from experience I have been called out in the early hours of the morning and had to quickly provide guidance and advice on a potential malware infection. Being able to pull a vmem file and perform some analysis using Volatility was a great way to quickly triage the incident.
For more information on how Varonis can help improve your organization’s security posture check out how Varonis’ DatAlert and Data Security Platform can detect threats and protect your sensitive data.