x64dbg is an open-source debugger for Windows that is a popular malware analysis tool. A debugger is used to step through code as it executes, so you can see exactly what it’s doing. Debuggers are essential for troubleshooting bugs, but they’re also used to reverse engineer malware.
This post kicks off a four-part series covering the tool and the following:
- Part 1: What is x64dbg + How to Use It
- Part 2: How to Unpack Malware With x64dbg
- Part 3: Stack Memory: An Overview
- Part 4: x64dbg Tutorial
An Overview of x64dbg
Unlike a programmer who has access to their own source code when debugging, malware analysts are usually working with compiled assembly code (such as a Windows .exe or .dll file).
Assembly code is a low-level programming language designed for a specific computer architecture such as 64bit architecture, hence the name x64dbg. There is also a version for 32bit architecture known as x32dbg.
It’s rare for a malware analyst to start with a debugger. First, they will perform some static analysis and perhaps even run the malware in a virtual machine with some behavioral analysis tools to try and understand what the malware is doing. A debugger may be used after this original phase to unpack the malware and then analyze the specific functionality of the malware known as reverse engineering.
Get a Free Data Risk Assessment
How to Install x64dbg
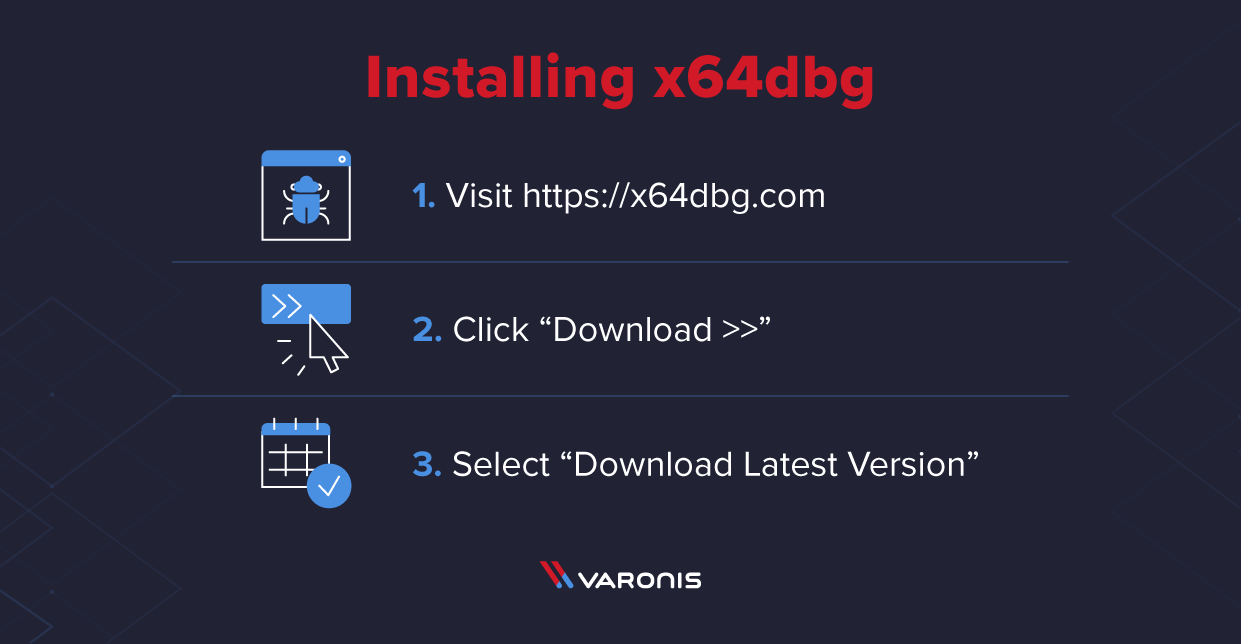
Installation of the tool is straightforward and can be downloaded from the official website’s https://x64dbg.com/ download page.
- Disclaimer: Do not attempt to analyze malware without first setting up a secure, virtualized environment. x64dbg should not be installed on your host machine to analyze malware.
Download the latest version of x64dbg which you’ll find as a ZIP in the downloads section of the x64dbg site. The contents can be extracted to a folder of your choosing and the standalone binaries can be run to launch the software, there are no installation steps to follow.
As mentioned earlier there are two versions one for 64-bit binaries and a second for 32-bit binaries. There is also a third option called x96 (64 + 32), this just allows the user to drag a piece of malware onto this icon and the correct version of the debugger will be loaded by checking the architecture.
What Does Each Window Do?
When a piece of malware is opened in x64dbg it can at first seem quite overwhelming and confusing.
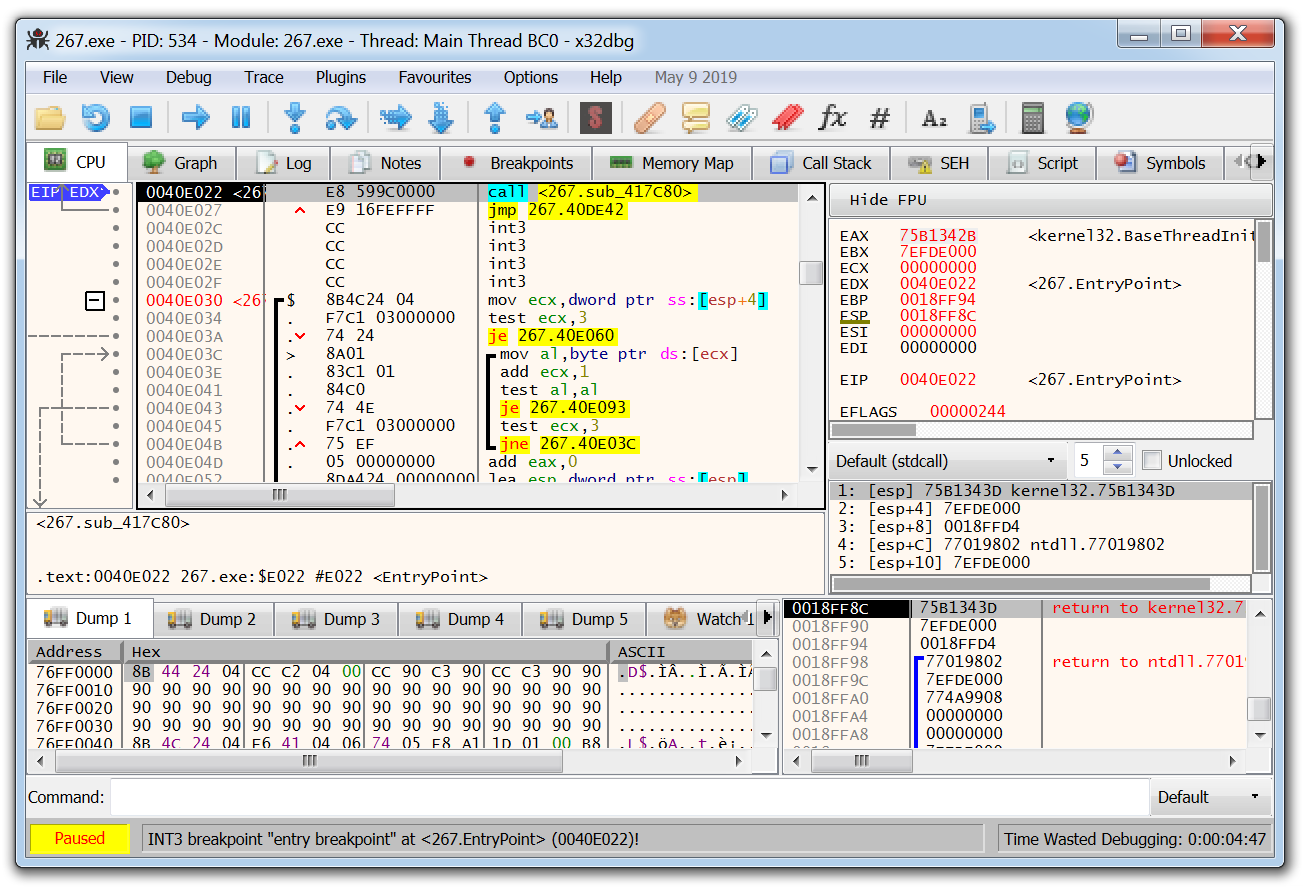
There are six main areas of the tool: five windows and the main toolbar, which can be seen below.
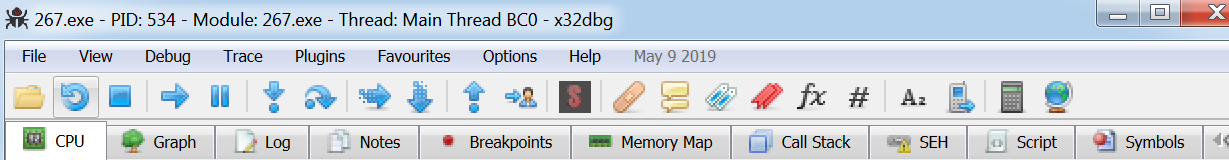
X64dbg Main Toolbar
The top, outermost part of the window shows the name of the file being analyzed ‘267.exe’, the process ID it has been allocated by the operating system and also the module that is currently being analyzed (we will cover the relevance of the module in a future article).
The icons on the toolbar are key to exploring the assembly code of the malware. The key ones for a beginner to understand can be seen in the below image.
![]()
The following icons are pretty straightforward:
- The folder icon is used to open a file for analysis
- The circular arrow is used to return to the start of the program
- The stop icon stops the program if it is running in x64dbg
- The arrow icon will run the program
- The pause icon will pause the program
The one’s that will be used often by a malware analyst are the last two.
The first is an arrow pointing downwards with a small circle below it. This is the ‘Step Into’ button, the next icon is the ‘Step Over’ button. Malware is made up of numerous functions that have been written or imported by the malware author, in order to analyze a specific function the analyst will need to ‘Step Into’ the function in order to view that function’s assembly code. Alternatively, a function that isn’t of interest can be ‘Stepped over’. Don’t worry if that doesn’t make sense just yet, this will be covered in-depth in a future article.
The row of tabs at the bottom of the image contains various views and data which can be used to make the analysis easier.
![]()
Some key tabs to understand are:
- CPU: Displays the assembly code from top to bottom

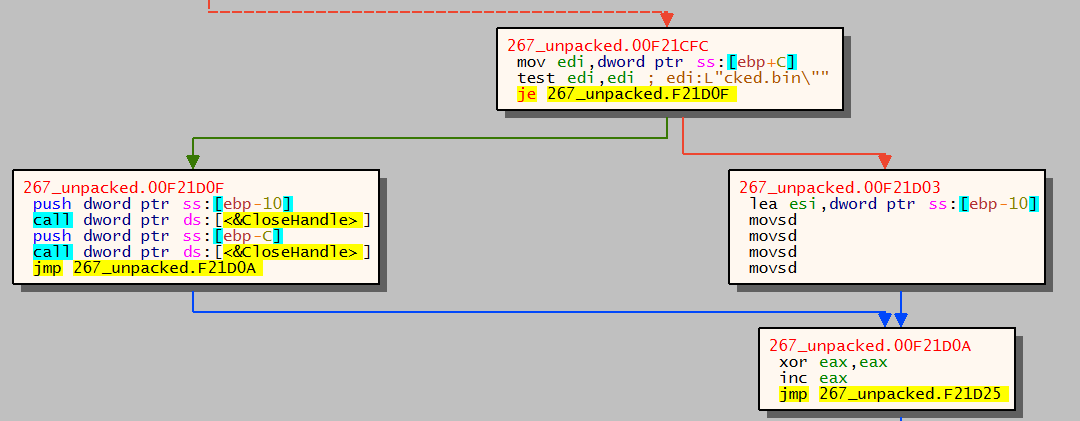
- Graph: Shows a graph view so the user can see visually which function is called by another. This is similar to other tools such as IDAPro and Ghidra.

- Breakpoints: It’s possible to search for instructions or strings that may be of interest and set breakpoints against these instructions. x64dbg then allows the user to run the program until it hits this breakpoint so it can then be analyzed. The below image shows some breakpoints which have been set on the Windows functions ‘CreateDirectoryW’ and ‘WriteFile’

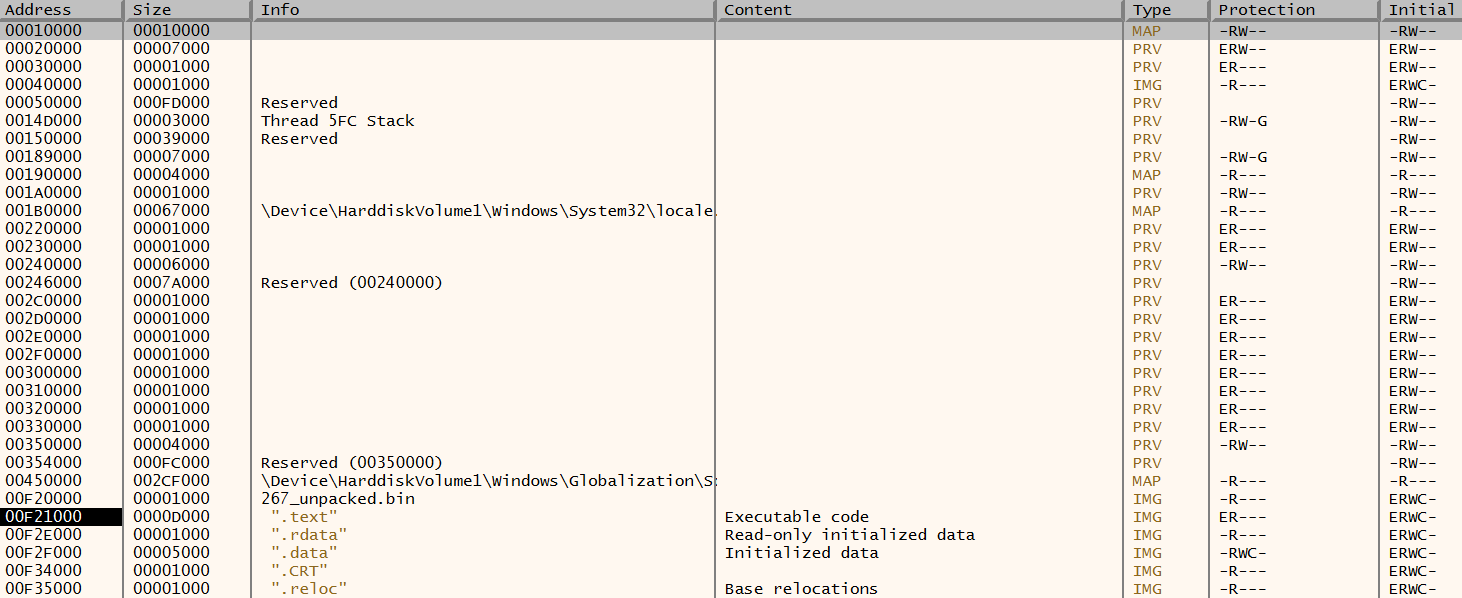
- Memory Map: This shows what data is stored in memory and the addresses where that data resides. In the example below the ‘.text’ section of the malware being analyzed is located at the address ‘00F21000’. The ‘Protection’ column also shows if that area in memory is executable, readable or writable. These can be identified by the flags E, R and W. This will come in handy when I explain how to use the memory map to unpack a piece of malware.

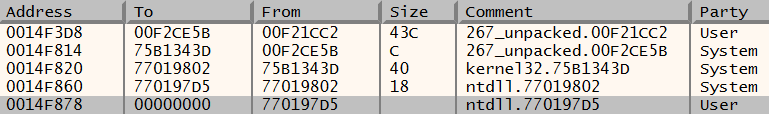
- Call Stack: This is handy when a breakpoint has been set on a specific Windows function. In a previous image, I had a breakpoint set on ‘CreateDirectoryW’ so each time the malware begins to create a directory on a compromised device, this breakpoint will be hit and x64dbg will stop on this function. Using the call stack I can see what code written by the malware author called ‘CreateDirectoryW’ and identify where that directory is being created and what it will be called.

X64dbg Main Window
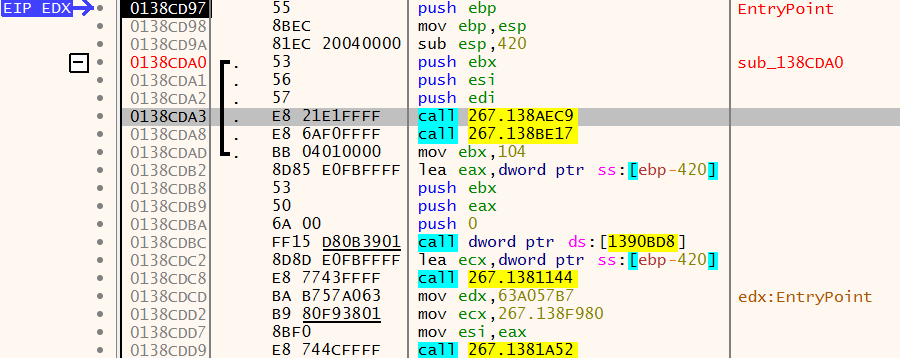
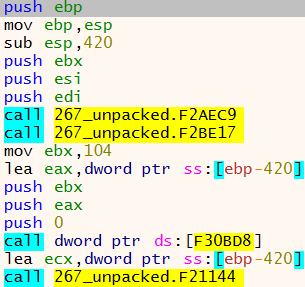
The main window in x64dbg contains the content of the tab that has been selected, by default this is the CPU tab that contains the assembly instructions.
The first column contains the EIP, which is the instruction pointer. This simply points to the next piece of code which will be run.
The second column contains addresses within the binary where instructions reside, so in the above example the EIP is pointing to the address ‘0138CD97’.
The third column is the hexadecimal representation of the instruction in column 4.
Column 4 is where the assembly instructions are located, again the above example shows the EIP pointing to the next instruction to be run is ‘push ebp’.
The fifth column will contain data populated by x64dbg or notes that have been added by the analyst. The above example shows that ‘0138CD97’ is the ‘EntryPoint’ of the malware, this means it is the start of the malware authors code and where the main function begins.
The third column, which contains the assembly instructions, is probably the most important as this data is what a malware analyst will use to understand what the malware is doing.
Some common instructions:
- PUSH: Pushes a value onto the stack
- POP: Pops a value off the stack
- CALL: Executes a function
- RET: Returns the value of a completed function
- JMP: Jumps to an address location
- CMP: Compares two values
- MOV: Moves data from one location to another
- ADD: Adds a value
- SUB: Subtracts a value
x64dbg Window Relating to Registers
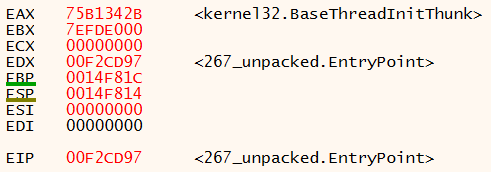
The next window contains information relating to the registers.
The registers are used by a program to store data which can then be easily referenced for later use, some of them have specific uses.
- EAX: Used for addition, multiplication and return values
- EBX: Generic register, used for various operations
- ECX: Used as a counter
- EDX: Generic register, used for various operations
- EBP: Used to reference arguments and local variables
- ESP: Points to the last argument on the stack
- ESI/EDI: Used in memory transfer instructions
The EIP isn’t a register, this is the instruction pointer that points to the current instruction in x64dbg. This field contains the address where the instruction resides.
x64dbg Window Relating to Stack Memory
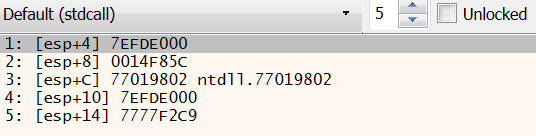
The third window contains parameters that have been pushed onto the stack. This will be covered in detail in a later article regarding how stack memory works.
x64dbg Window Containing Stack and Data
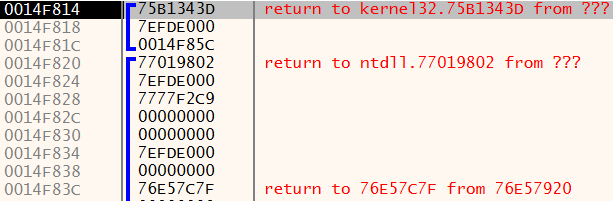
The fourth window contains the stack and data that has been pushed onto the stack and the addresses in memory they are mapped to. Again this will also be covered in detail in a later article.
x64dbg Window Containing Dump Data
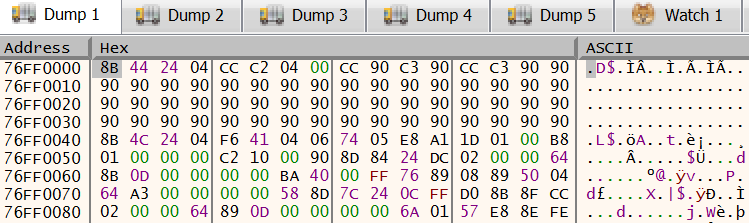
The sixth and final window contains dump data. The ‘dump’ windows allow the user to see what data is being stored in a register or what data resides at a certain address.
That may seem like a lot to take in at first, but this article should hopefully provide you with a solid understanding of what x64dbg is and how to navigate the tool.
Over the next few articles, I will explain the methodology I use to reverse engineer malware, explain stack memory and how x64dbg uses it and finally, we will get hands-on with some malware and demonstrate some reverse engineering skills.
For information regarding best practices with malware protection,Varonis offers free trials and tutorials available for DatAlert which is a behavior-based threat detection product that uses machine learning to identify threats in your environment.