
If you find yourself troubleshooting network issues, and you have to inspect individual packets, you need to use Wireshark. Wireshark is the de facto, go-to, you-need-to-know-how-to-use, application to capture and investigate network traffic.
And because Wireshark is the predominant tool for this job, let’s go over some application basics, such as where you can download Wireshark, how to capture network packets, how to use filters, and more.
- What is Wireshark?
- When should Wireshark be used?
- How to download Wireshark
- Data packets on Wireshark
- Wireshark filters
- Additional Wireshark features
- Wireshark resources
What is Wireshark?
Wireshark is an open-source network protocol analysis software program, widely considered the industry standard. A global organization of network specialists and software developers supports Wireshark and continues to make updates for new network technologies and encryption methods.
Government agencies, corporations, non-profits, and educational institutions use Wireshark for troubleshooting and teaching purposes. There truly isn’t a better way to learn low-level networking than to look at traffic under the Wireshark microscope.
You should only use Wireshark on networks where you have permission to inspect network packets. Using Wireshark to look at packets without permission is illegal.
How does Wireshark work?
Wireshark is a packet sniffer and analysis tool. It captures network traffic from ethernet, Bluetooth, wireless (IEEE.802.11), token ring, and frame relay connections, among others, and stores that data for offline analysis.
Editor’s Note: A “packet” is a single message from any network protocol (e.g., TCP, DNS, etc.).
Editor’s Note 2: LAN traffic is in broadcast mode, meaning a single computer with Wireshark can see traffic between two other computers. To see traffic to an external site, you need to capture the packets on the local computer.
Wireshark allows you to filter the log before the capture starts or during analysis, so you can narrow down and zero in on what you’re looking for in the network trace. For example, you can set a filter to see TCP traffic between two IP addresses, or you can set it only to show you the packets sent from one computer. The filters in Wireshark are one of the primary reasons it has become the standard tool for packet analysis.
When should Wireshark be used?
Wireshark can be used to understand how communication takes place across a network and to analyze what went wrong when an issue in communication arises.
Wireshark helps:
- Network administrators troubleshoot problems across a network
- Security engineers examine security issues across a network
- QA engineers verify applications
- Developers debug protocol implementations
- Network users learn about a specific protocol
When shouldn’t Wireshark be used?
Wireshark can help troubleshoot many network issues, and it can be used as an educational tool. However, Wireshark cannot:
- Help a user who doesn’t understand network protocols: Users must first know how a network operates in order to use Wireshark.
- Grab traffic from locations other than your local computer and the system it talks to: Wireshark cannot grab traffic from all of the other systems on a network.
- Notify you of alerts: The closest Wireshark can do is apply color-coding and show malformed packets.
How to download Wireshark
Downloading and installing Wireshark is easy. Step one is to check the official Wireshark download page for the operating system you need. The installation is simple, and the basic version of Wireshark is free.
Wireshark for Windows
Wireshark comes in two options for Windows: 32-bit and 64-bit. Pick the correct version for your OS; the current release is 3.0.3 as of this writing.
Wireshark for Mac
Wireshark is available on Mac as a Homebrew install.
To install Homebrew, you need to run this command at your Terminal prompt:
/usr/bin/ruby -e "$(curl -fsSL https://raw.githubusercontent.com/Homebrew/install/master/install)”
Once you have the Homebrew system in place, you can access several open-source projects for your Mac. To install Wireshark, run this command from the Terminal:
brew install wireshark
Homebrew will download and install Wireshark and any dependencies needed to function correctly.
Wireshark for Linux
Installing Wireshark on Linux can be a little different depending on the Linux distribution. If you aren’t running one of the following distros, please double-check the commands.
Ubuntu
From a Terminal prompt, run these commands:
- sudo apt-get install wireshark
- sudo dpkg-reconfigure wireshark-common
- sudo adduser $USER wireshark
Those commands download and update the package, and add user privileges to run Wireshark.
Red Hat Fedora
From a Terminal prompt, run these commands:
- sudo dnf install wireshark-qt
- sudo usermod -a -G wireshark username
The first command installs the GUI and CLI version of Wireshark, and the second adds permissions to use Wireshark.
Kali Linux
Wireshark is probably already installed because it’s part of the basic package. Check your menu under the option “Sniffing & Spoofing” to verify.
Data packets on Wireshark
Now that we have Wireshark installed, let’s go over how to enable the Wireshark packet sniffer and then analyze the network traffic.
Go beyond the wire with your security.
Wireshark will tell you what is happening in your network traffic, but it won't tell you why.
Varonis adds context to network events, user actions and attacks. Want to find out more?
Capturing data packets on Wireshark
When you open Wireshark, you see a screen showing you a list of all the network connections you can monitor. You also have a capture filter field to only capture the network traffic you want to see.
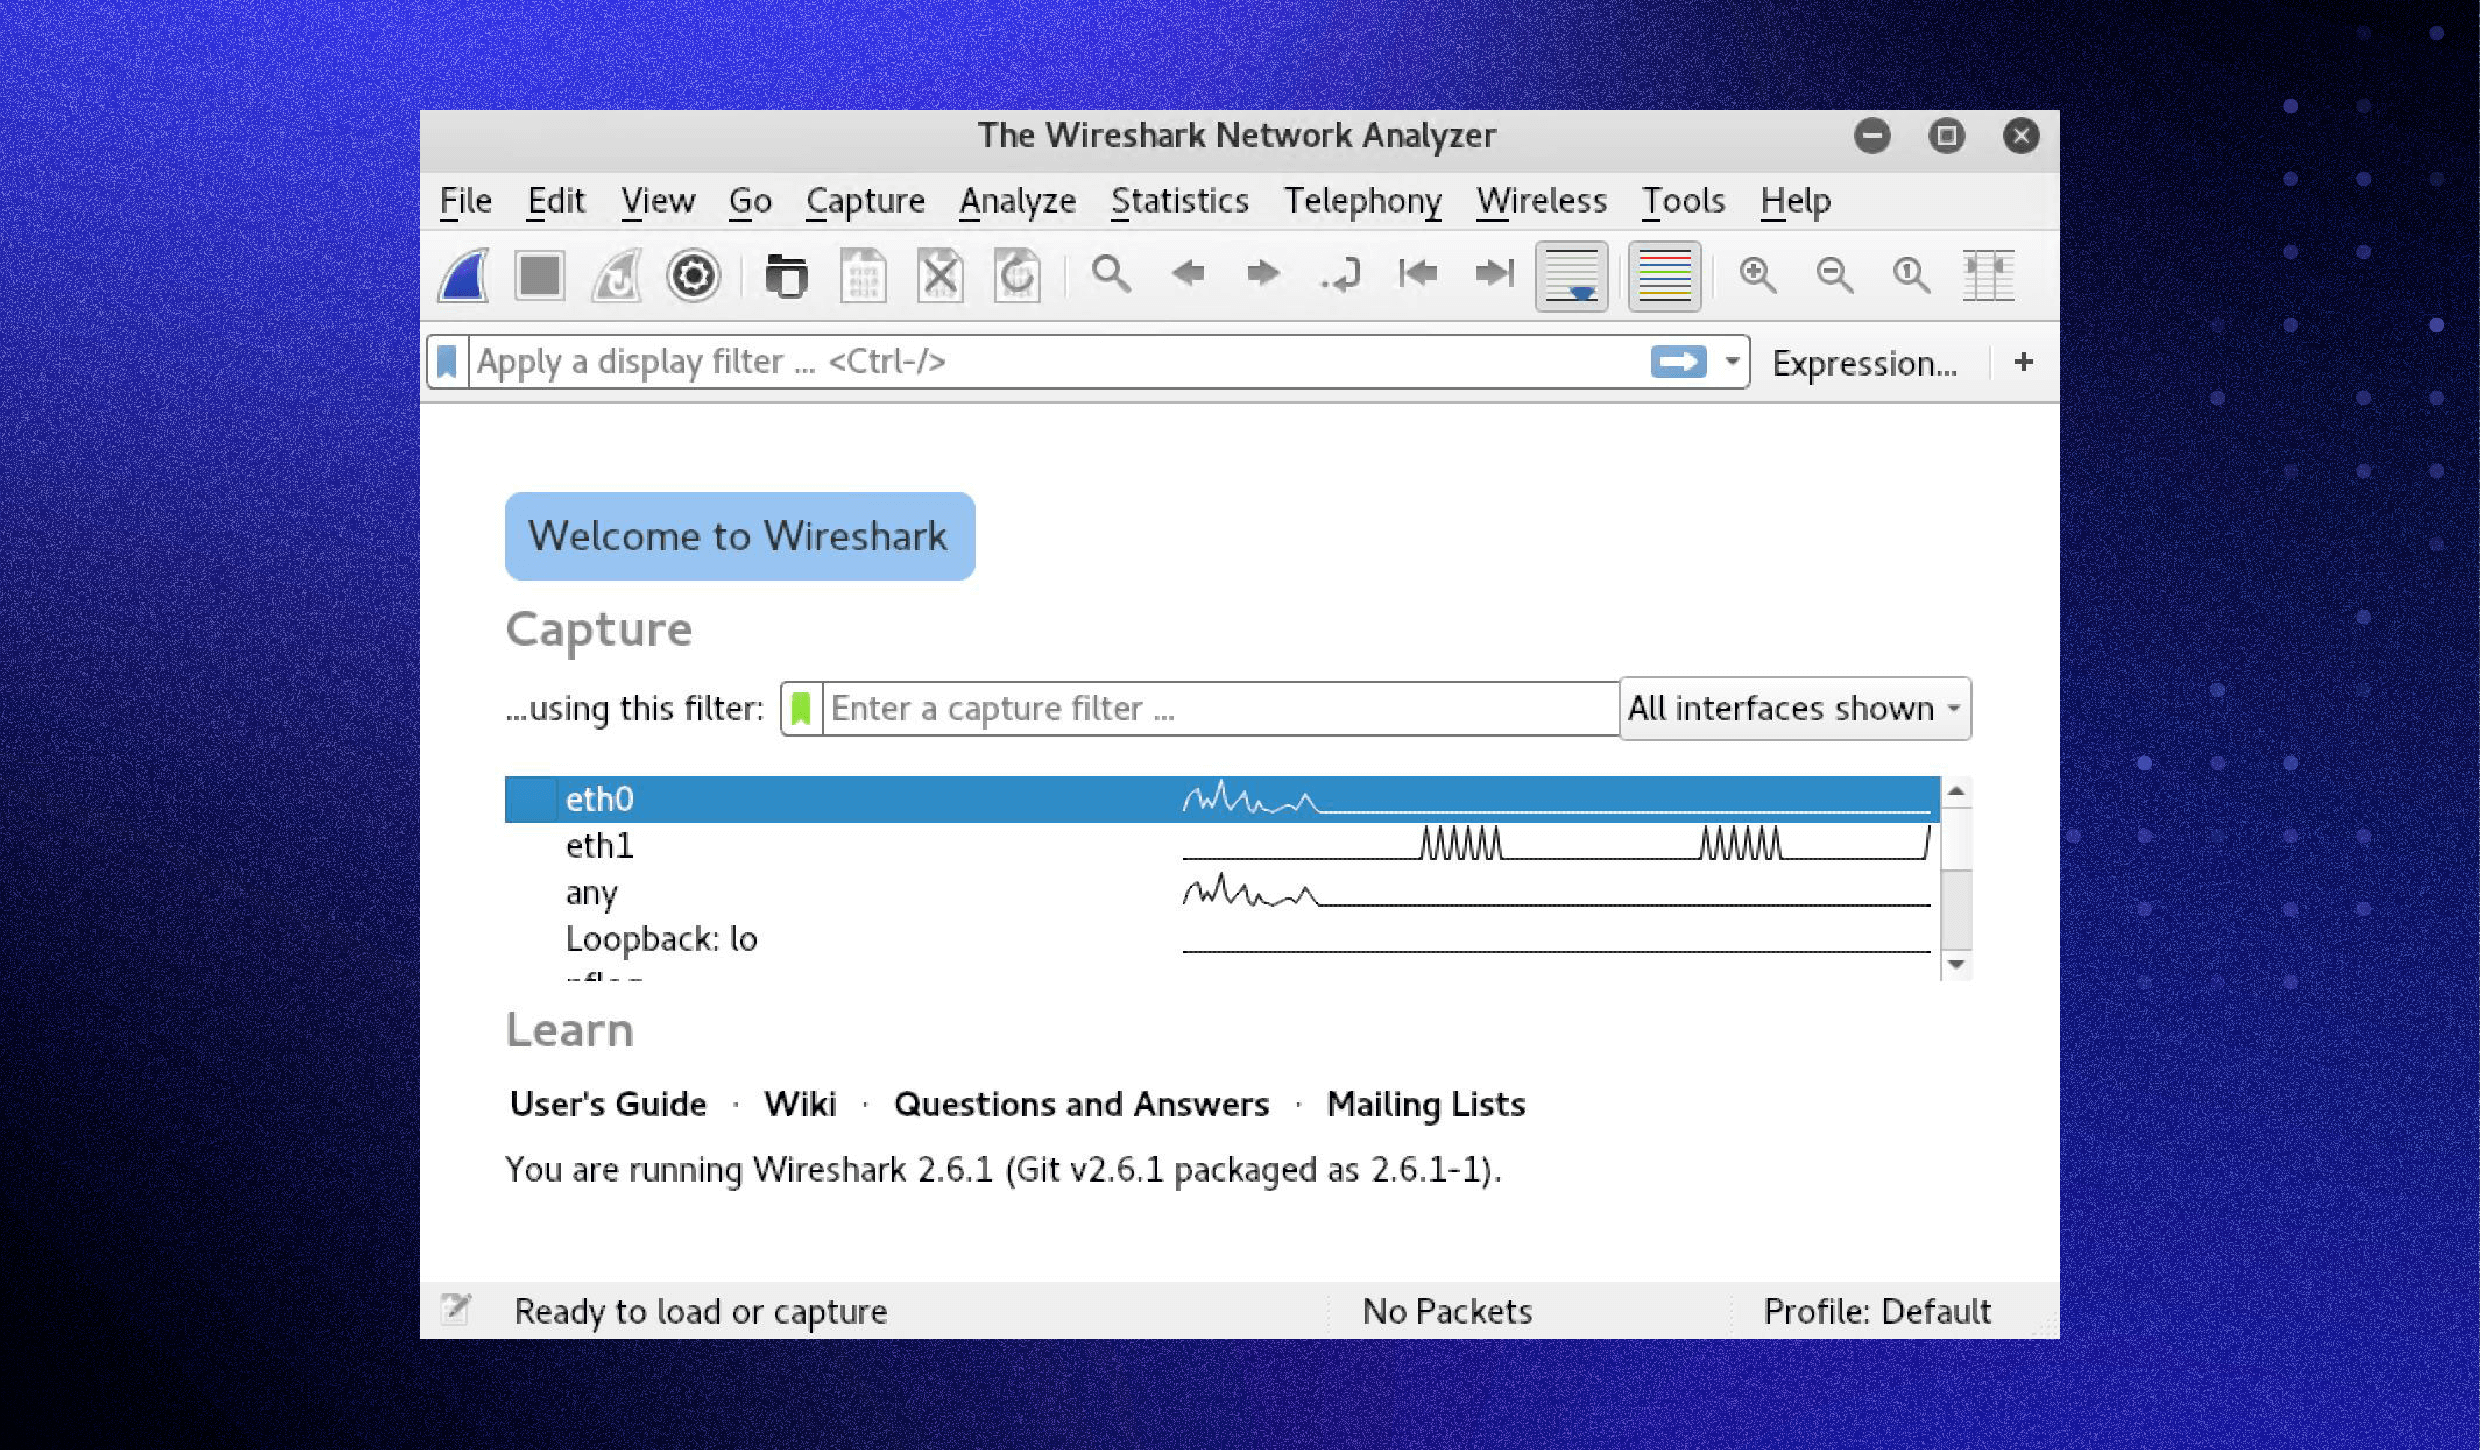
You can select one or more of the network interfaces using shift+left-click. Once select the network interface, you can start the capture, and there are several ways to do that.
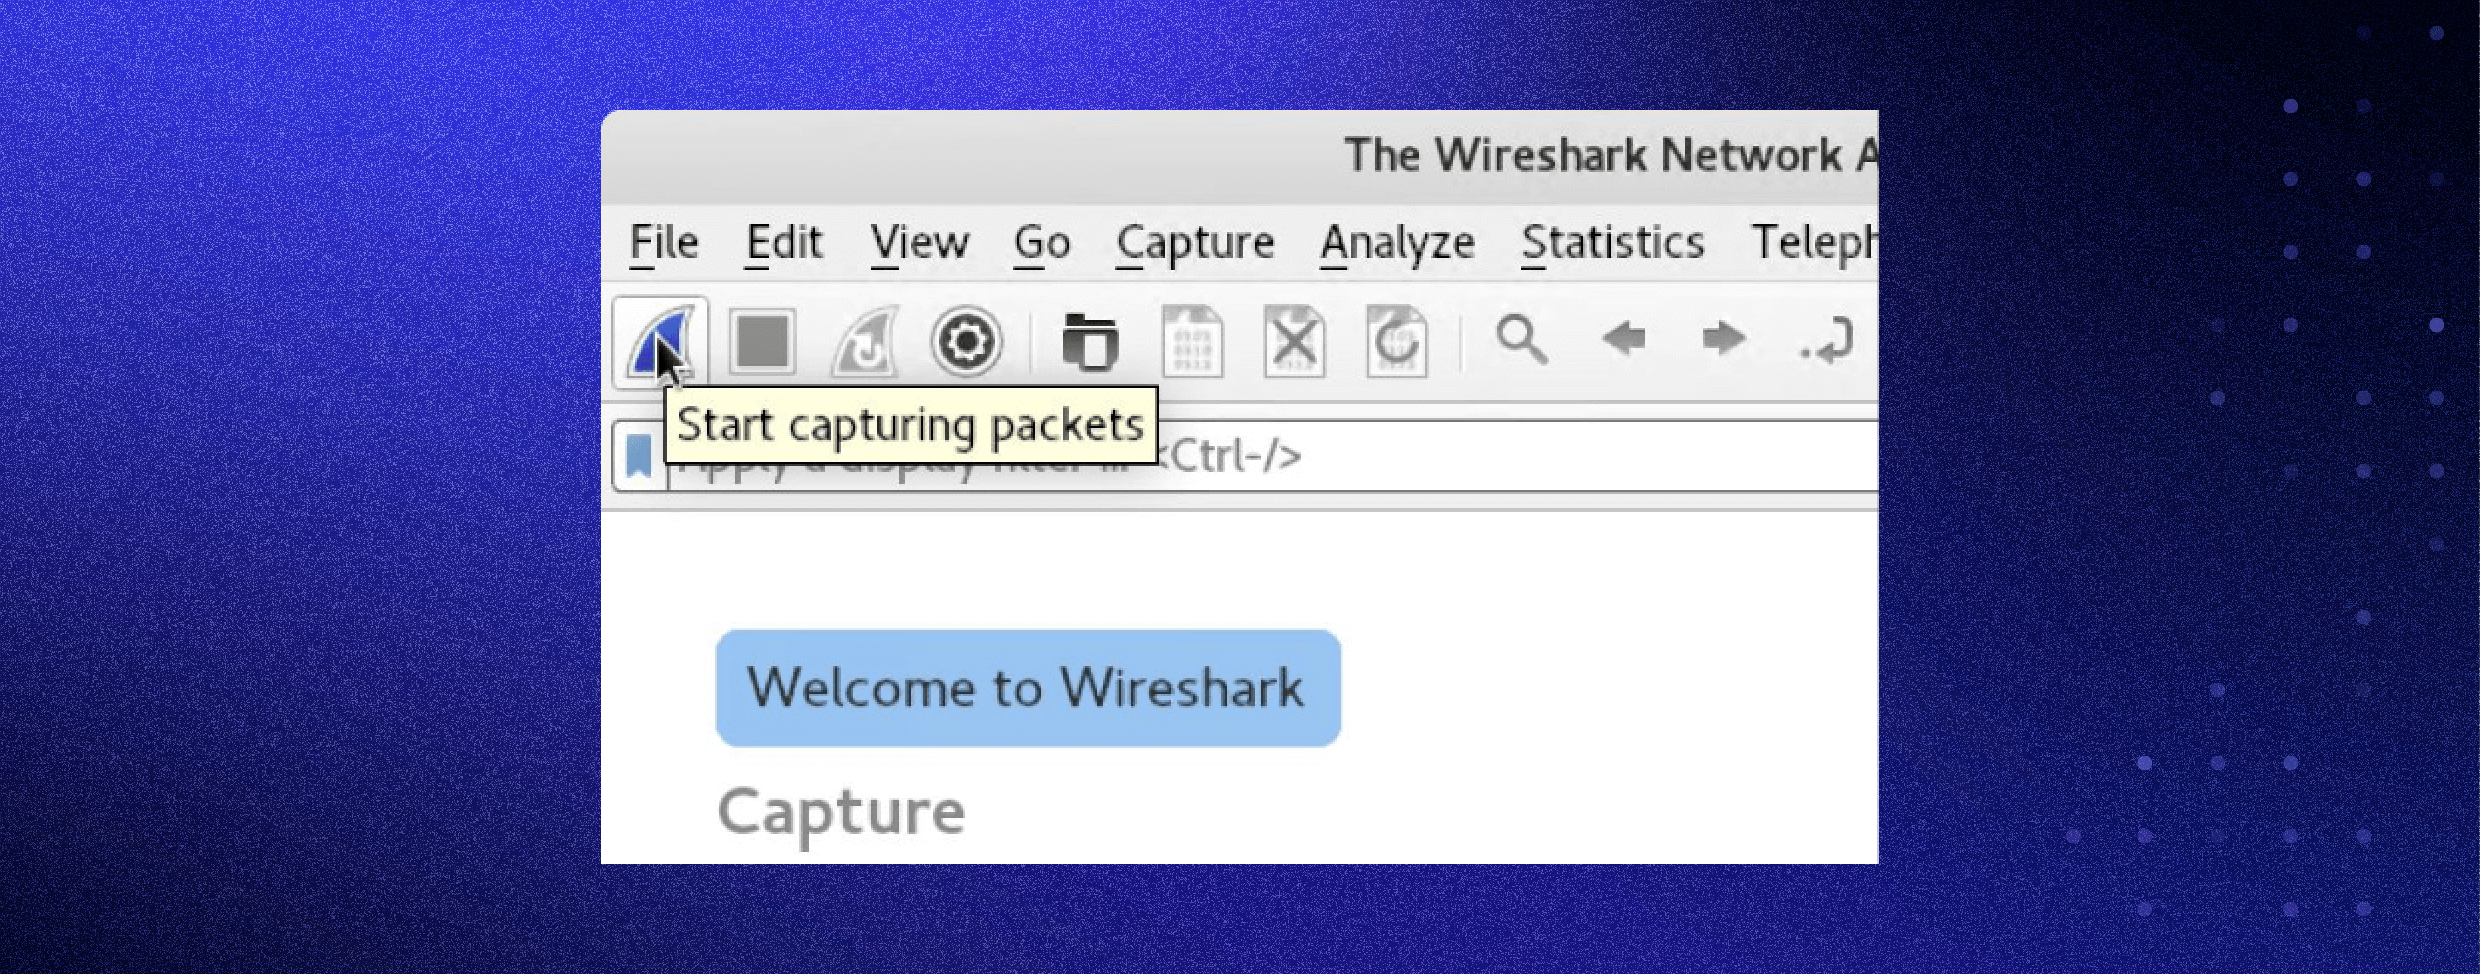
Click the first button on the toolbar, titled “Start capturing packets.”
You can select the menu item Capture -> Start.
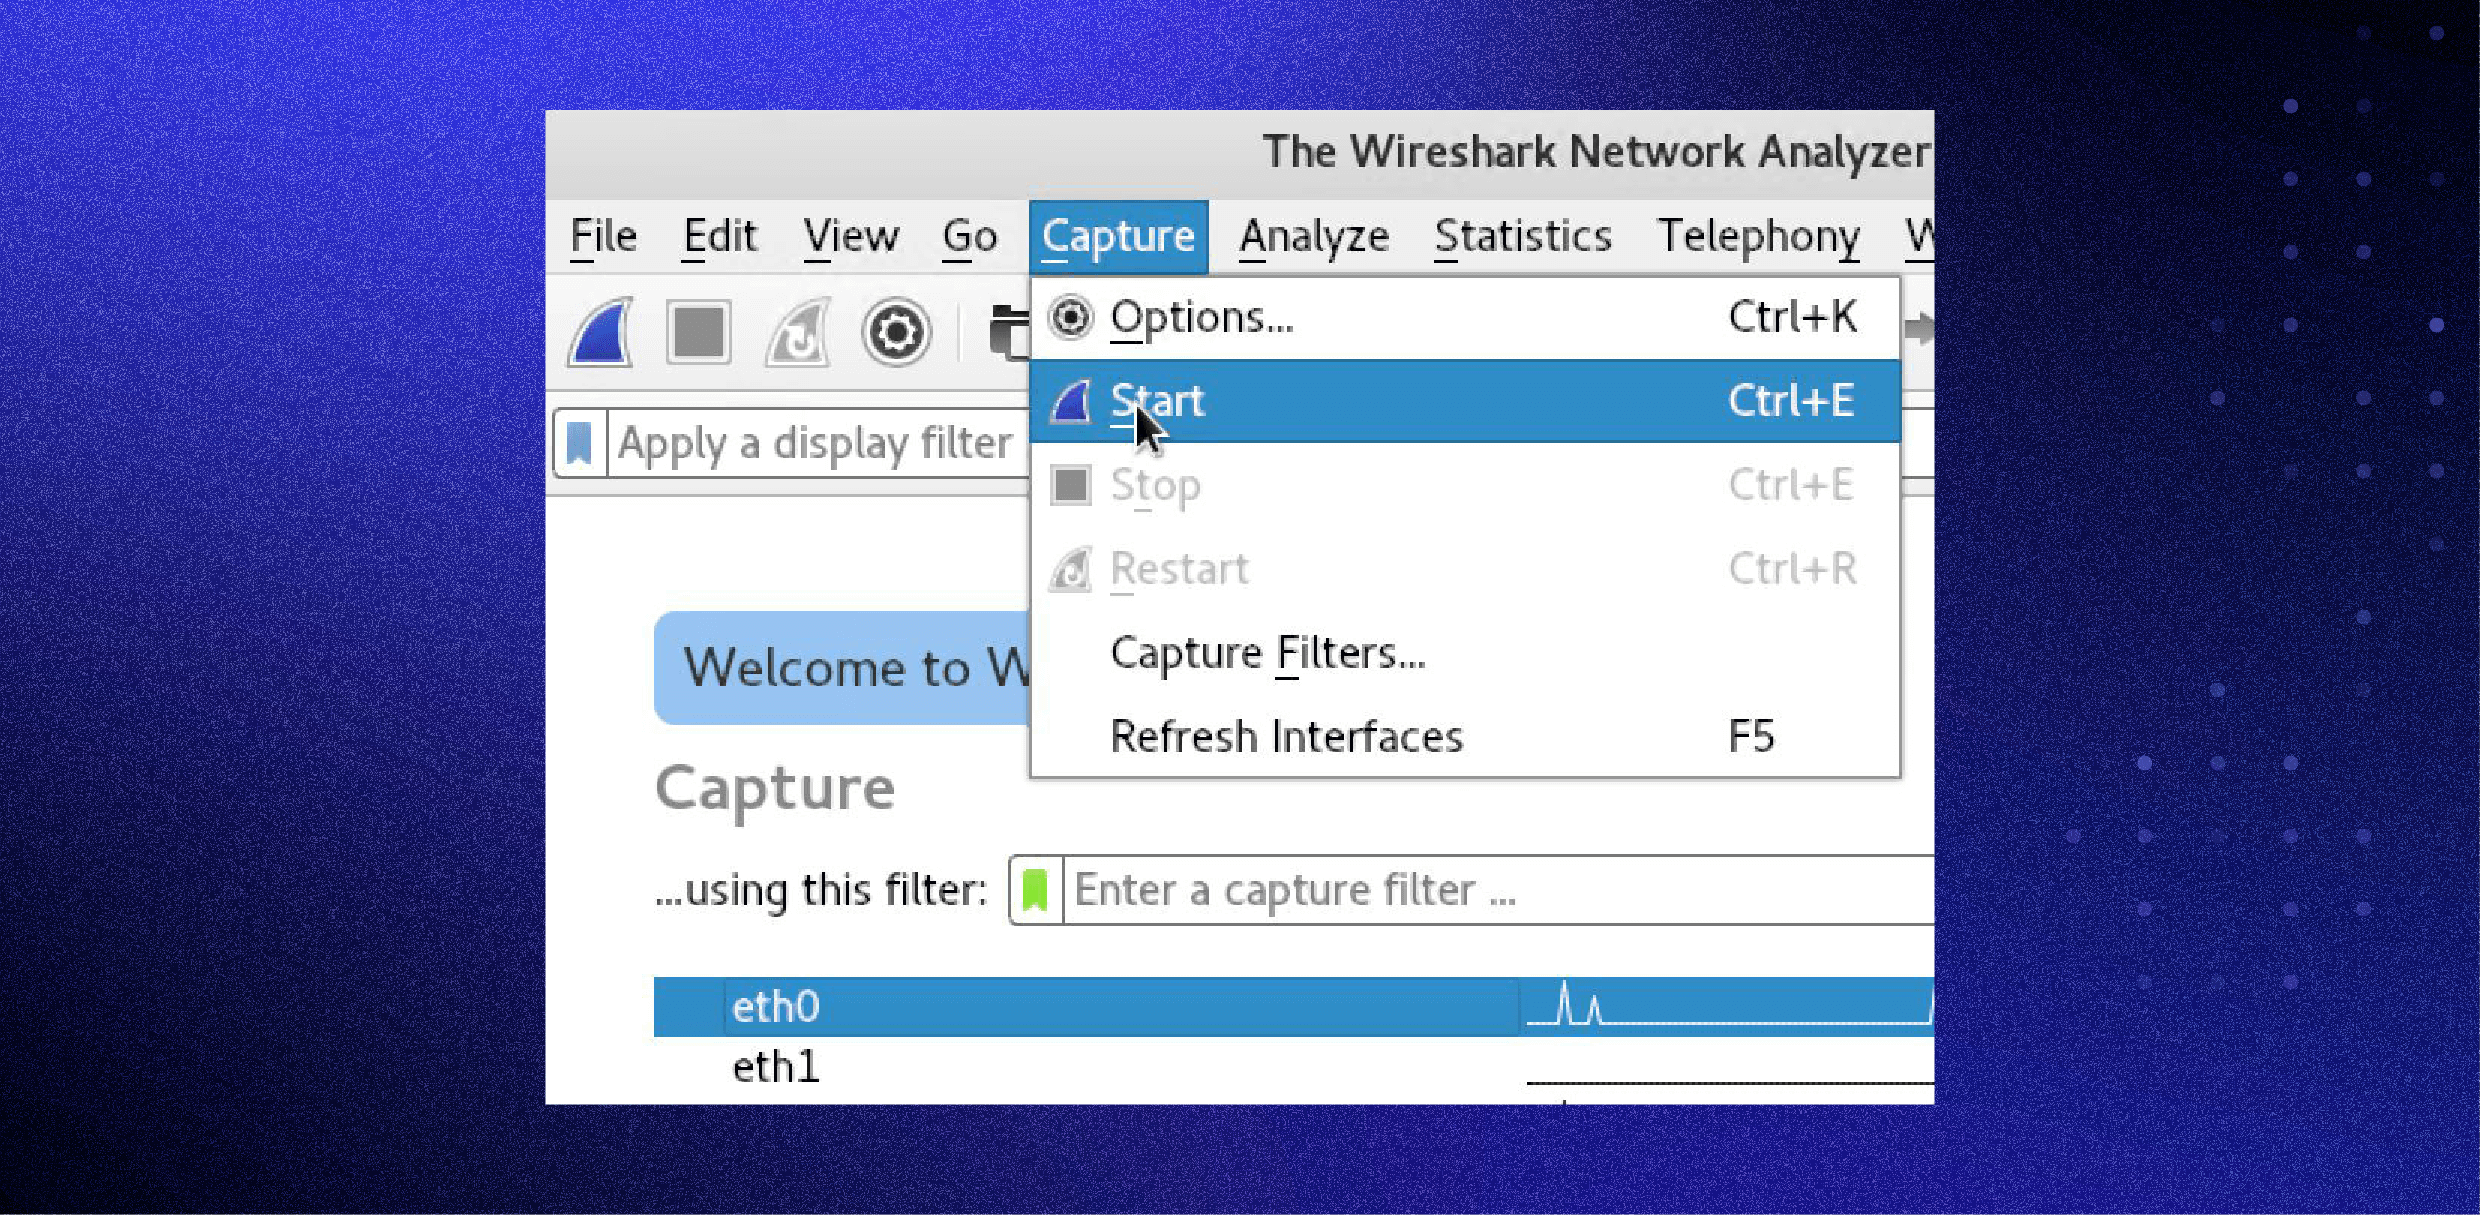
Or you could use the keystroke Control+E.
During the capture, Wireshark will show you the packets captured in real-time.
Once you have captured all the packets needed, use the same buttons or menu options to stop the capture as you did to begin.
Best practice dictates stopping Wireshark’s packet capture before analysis.
Analyzing data packets on Wireshark
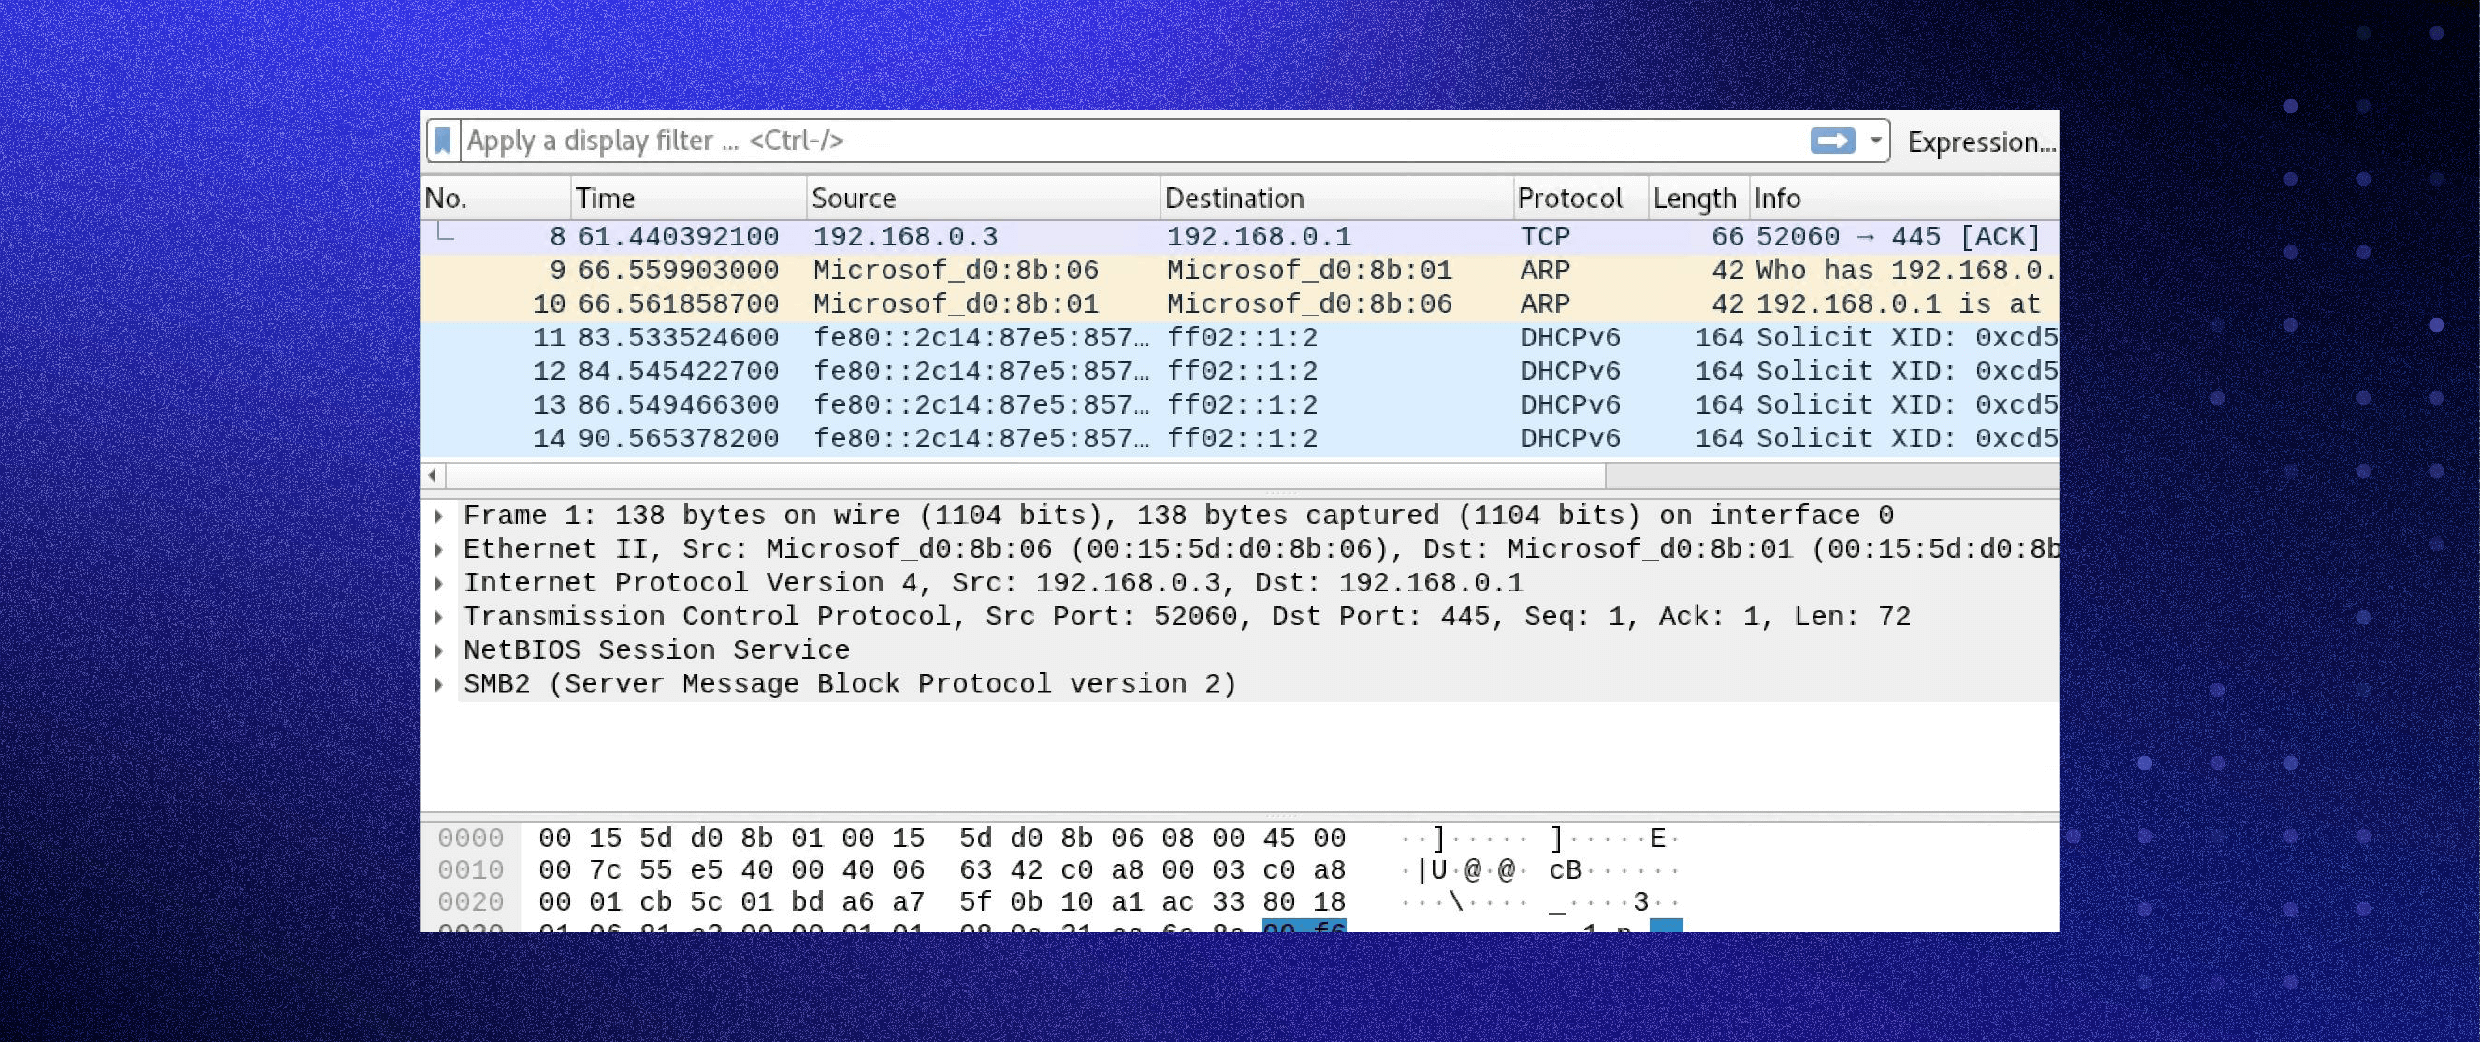
Wireshark shows you three different panes for inspecting packet data. The Packet List, the top pane, lists all the packets in the capture. When you click on a packet, the other two panes change to show you the details about the selected packet. You can also tell if the packet is part of a conversation. Here are details about each column in the top pane:
- No.: This is the number order of the packet captured. The bracket indicates that this packet is part of a conversation.
- Time: This column shows how long after you started the capture this particular packet was captured. You can change this value in the Settings menu to display a different option.
- Source: This is the address of the system that sent the packet.
- Destination: This is the address of the packet destination.
- Protocol: This is the type of packet. For example: TCP, DNS, DHCPv6, or ARP.
- Length: This column shows you the packet’s length, measured in bytes.
- Info: This column shows you more information about the packet contents, which will vary depending on the type of packet.
Packet Details, the middle pane, shows you as much readable information about the packet as possible, depending on the packet type. You can right-click and create filters based on the highlighted text in this field.
The bottom pane, Packet Bytes, displays the packet exactly as it was captured in hexadecimal.
When looking at a packet that is part of a conversation, you can right-click the packet and select Follow to see only the packets that are part of that conversation.
Wireshark filters
Some of the best features of Wireshark are the capture filters and display filters. Filters allow you to view the capture the way you need to see it to troubleshoot the issues at hand. Below are several filters to get you started.
Wireshark capture filters
Capture filters limit the captured packets by the chosen filter. If the packets don’t match the filter, Wireshark won’t save them. Examples of capture filters include:
host IP-address: This filter limits the captured traffic to and from the IP address
net 192.168.0.0/24: This filter captures all traffic on the subnet
dst host IP-address: Capture packets sent to the specified host
port 53: Capture traffic on port 53 only
port not 53 and not arp: Capture all traffic except DNS and ARP traffic
Wireshark display filters
Wireshark display filters change the view of the capture during analysis. After you’ve stopped the packet capture, use display filters to narrow down the packets in the Packet List to troubleshoot your issue.
One of the most useful display filters is:
ip.src==IP-address and ip.dst==IP-address
This filter shows packets sent from one computer (ip.src) to another (ip.dst). You can also use ip.addr to show packets to and from that IP. Other filters include:
tcp.port eq 25: This filter will show you all traffic on port 25, which is usually SMTP traffic
icmp: This filter will show you only ICMP traffic in the capture, most likely they are pings
ip.addr != IP_address: This filter shows you all traffic except the traffic to or from the specified computer
Analysts even build filters to detect specific attacks, like this filter used to detect the Sasser worm:
ls_ads.opnum==0x09
Additional Wireshark features
Beyond the capture and filtering, several other features in Wireshark can make your job easier.
Wireshark colorization options
You can configure Wireshark to color your packets in the Packet List according to the display filter, which allows you to emphasize the packets you want to highlight. Check out some examples here.
Wireshark promiscuous mode
By default, Wireshark only captures packets going to and from the computer where it runs. By checking the box to run Wireshark in promiscuous mode in the capture settings, you can capture most of the traffic on the LAN.
Wireshark command line
Wireshark does provide a command line interface (CLI) if you operate a system without a graphical user interface (GUI). The best practice would be to use the CLI to capture and save a log so you can review the log with the GUI.
Wireshark commands
- wireshark : run Wireshark in GUI mode
- wireshark –h : show available command line parameters for Wireshark
- wireshark –a duration:300 –i eth1 –w wireshark. : capture traffic on the ethernet interface one for five minutes. –a means automatically stop the capture, -i specifies which interface to capture
Metrics and statistics
Under the Statistics menu, you’ll find a plethora of options to view details about your capture.
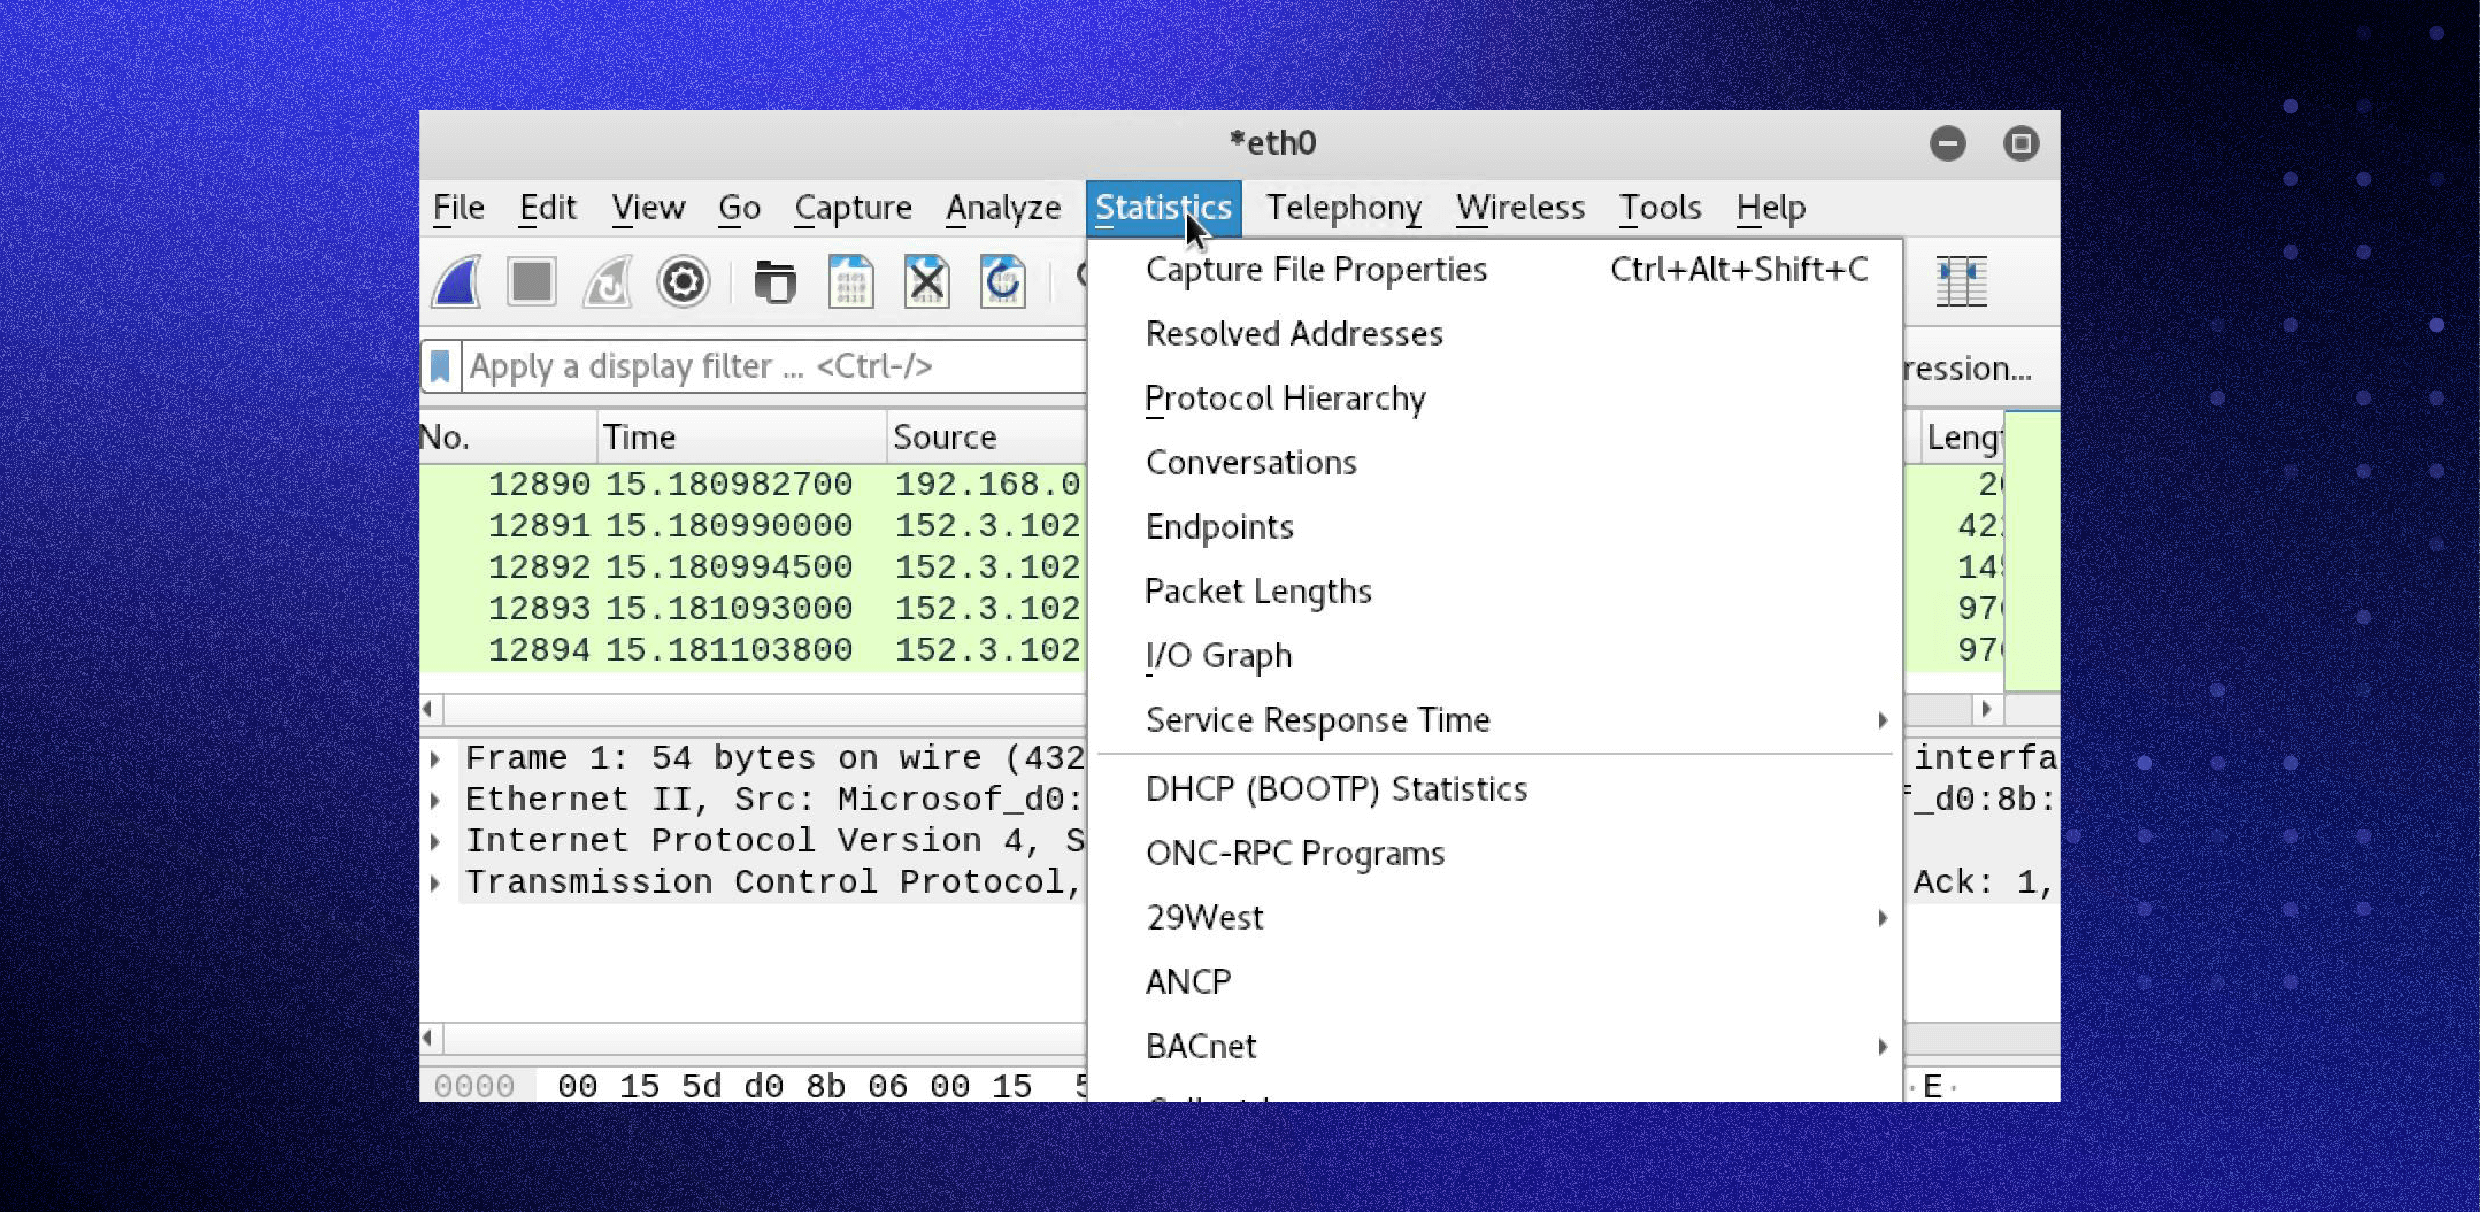
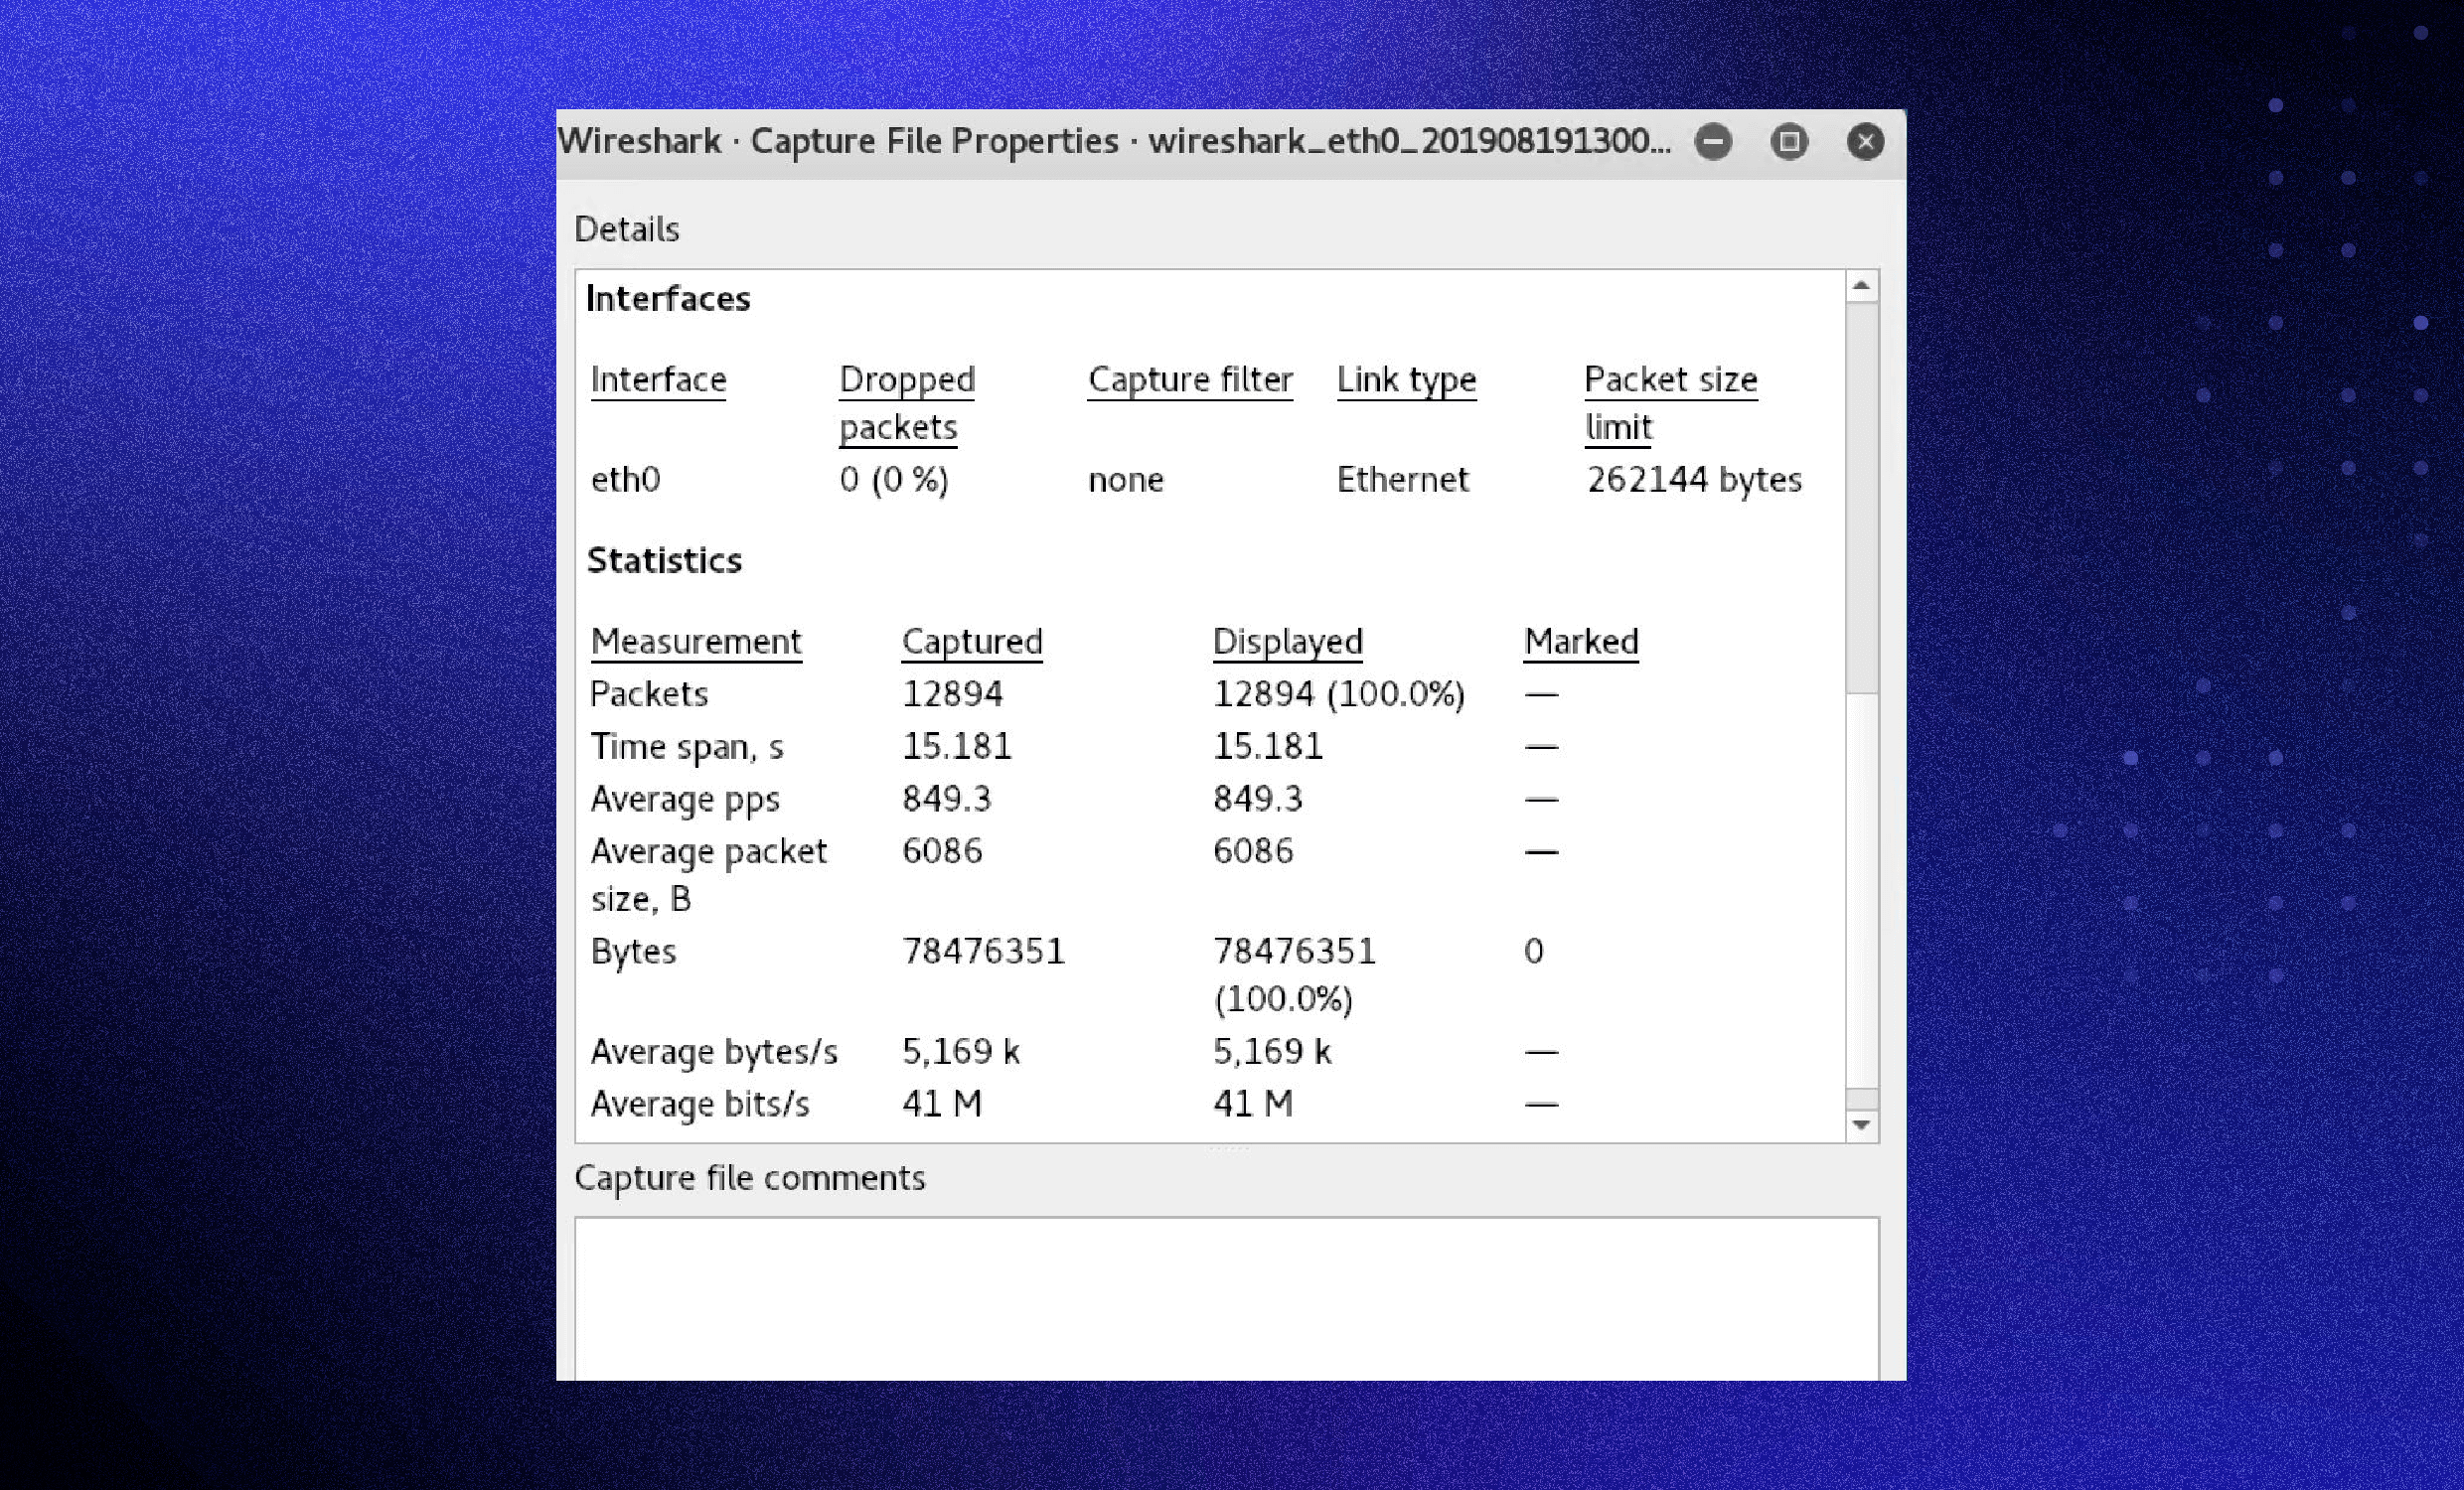
Capture File Properties:
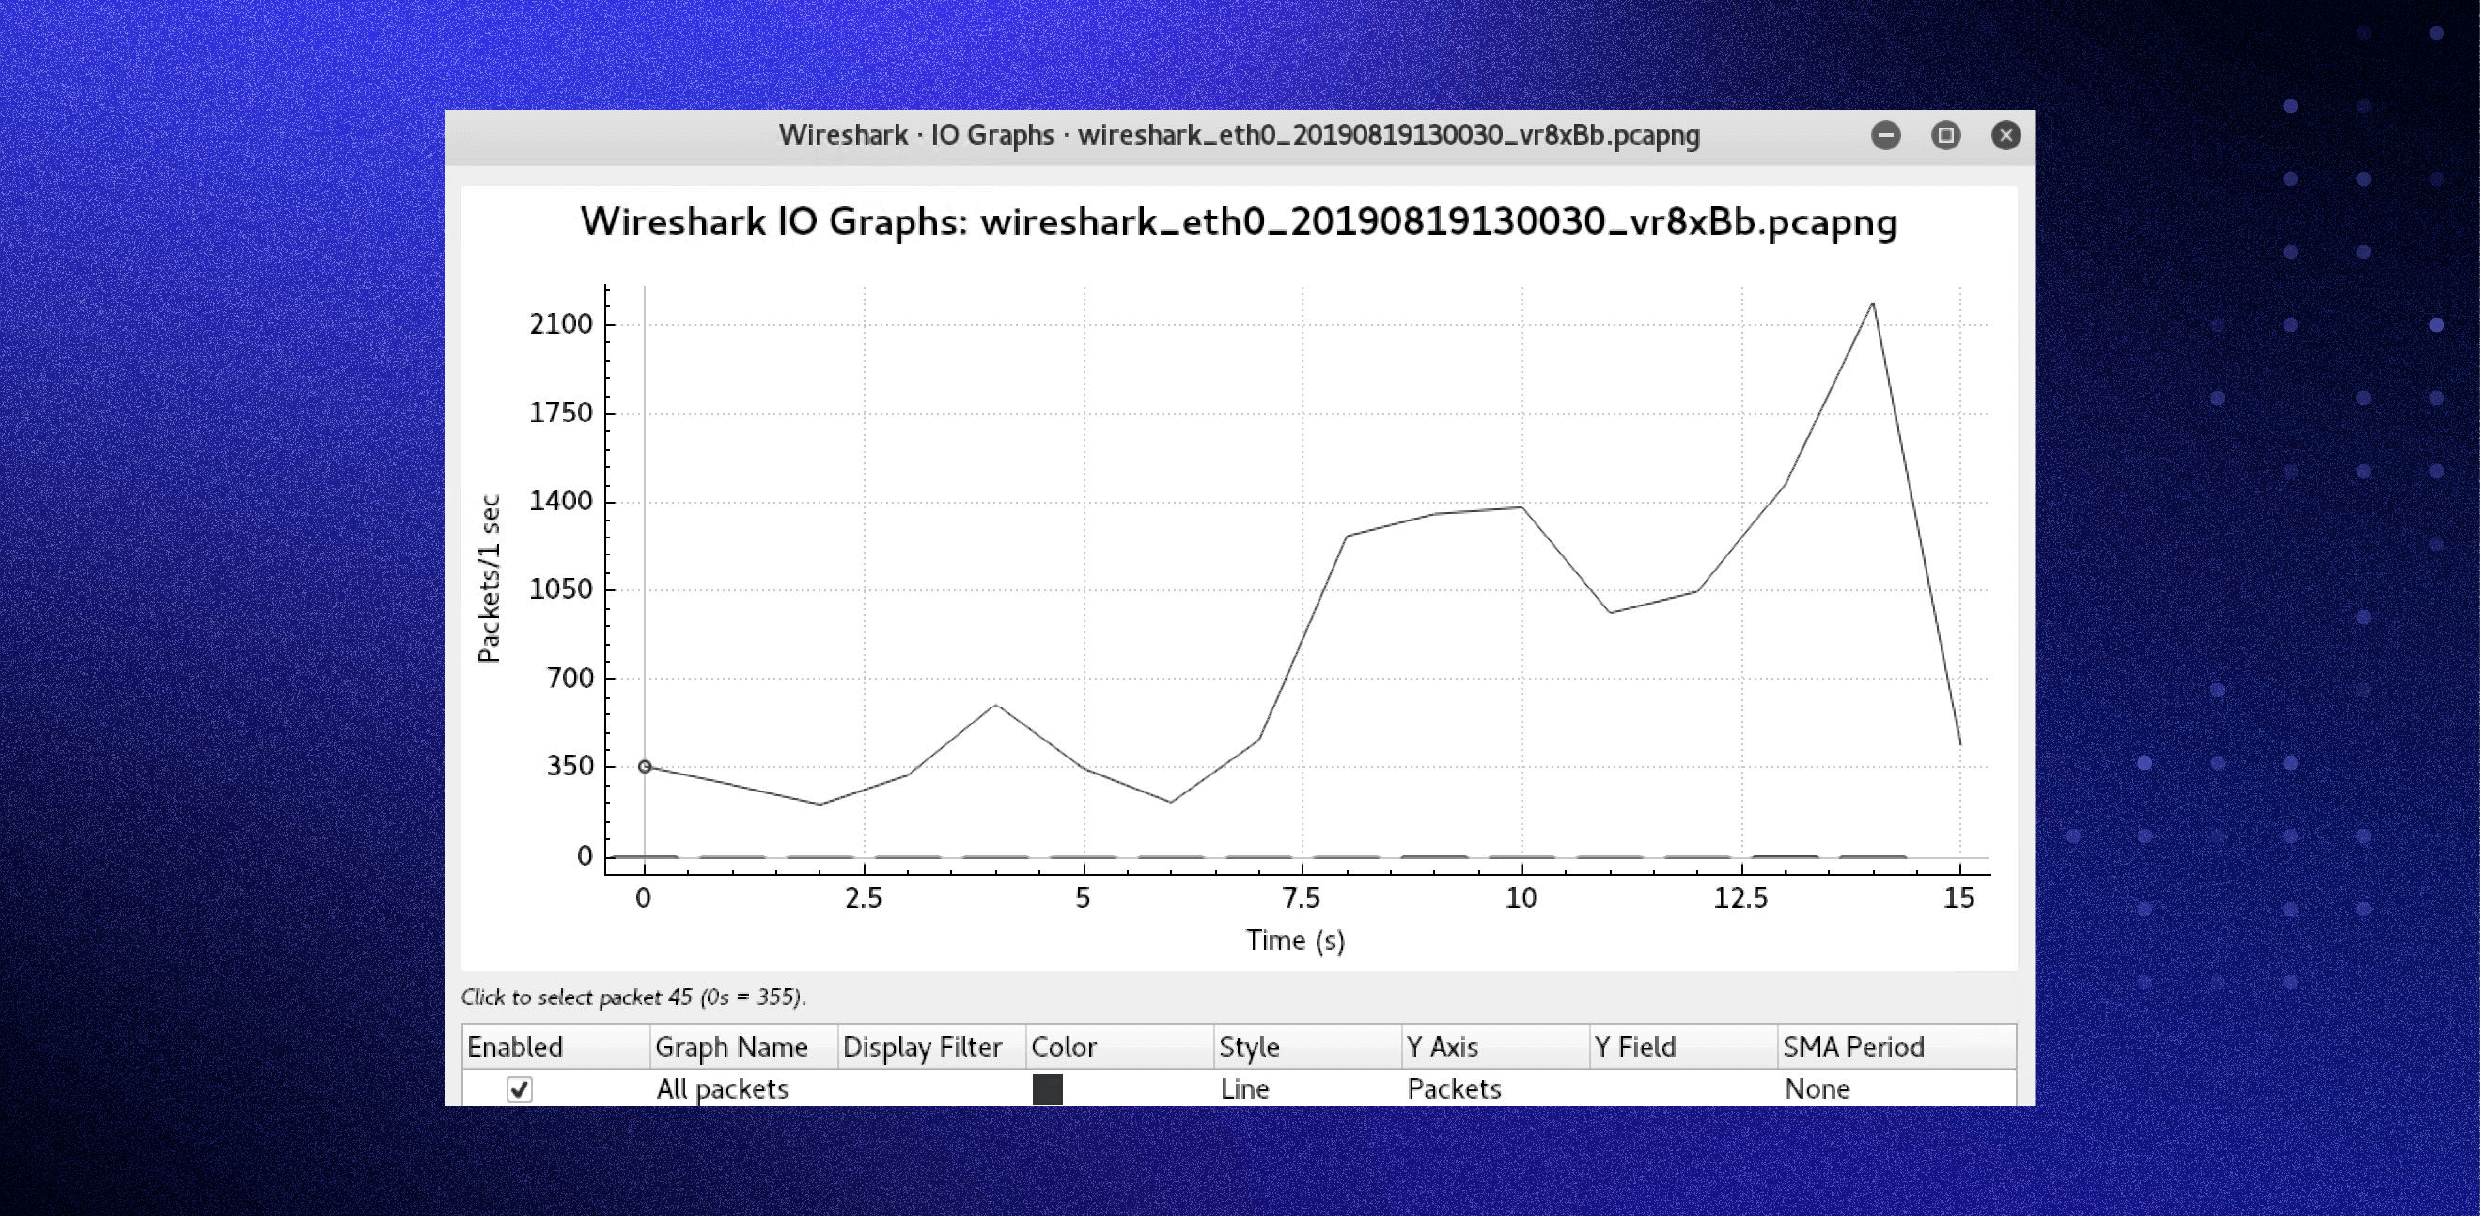
Wireshark I/O Graph:
Additional Wireshark resources and tutorials
There are many tutorials and videos that show you how to use Wireshark for specific purposes. You should begin your search on the main Wireshark website and move forward from there. You can find the official documentation and Wiki on that site as well.
Wireshark is a great network sniffer and analysis tool — however, it’s best used once you know what you’re looking for. You won’t be able to use Wireshark to discover a new problem because there is too much noise on the network. Varonis with Edge will help make sense of the overall situation and point you to a threat to investigate; you would then use Wireshark to dig deeper to understand the threat within the packet.
A great example of this is when Varonis security researchers discovered the Norman crypto miner, they received an alert from several machines pointing to suspicious network and file activity. During the analysis of the crypto miner, Varonis researchers used Wireshark to inspect network activities for some of the machines that were misbehaving. Wireshark showed the research team that a new cryptominer, dubbed Norman, was actively communicating to command and control (C&C) servers using DuckDNS. The Varonis team could see all the IP addresses of the C&C servers the attackers used with Wireshark so the company could shut off communication, stopping the attack.
To see the Varonis team in action, sign up for a live Cyberattack demo.


-1.png)