
If you work in incident response you understand how critical it is to pull forensically sound evidence from compromised devices as soon as possible. This is often in the form of logs or hard disk images.
Both can present challenges and be time-consuming, if you pull the logs from a device then you could be presented with millions of lines of logs and need to spend time understanding the content, ingesting it into a platform that makes the analysis easier, or manually querying the data using the Linux command-line.
Get a Free Data Risk Assessment
Hard disk images can be time-consuming to capture and transfer due to the size of the disks, this is before any analysis has even taken place. For these reasons, this is why one of my first questions on an incident is always ‘Can we capture the memory?’.
The reason being is that the memory, or RAM, of a device, will be smaller than the size of a hard disk and can be easy to capture. Once you have the captured RAM you can then quickly analyze the output using one of my favorite incident response tools, Volatility.
This article will cover what Volatility is, how to install Volatility, and most importantly how to use Volatility.
What to Know Before Getting Started
Due to the size of Volatility this will not be a comprehensive list of the functionality of the tool, instead it will serve as an introduction to the tool and give you a strong foundation of knowledge of which to build on.
Before diving into using a tool like Volatility there are some key topics that you will need to understand:
- What is volatile data?
- What is a memory dump?
- How to capture RAM in a forensically sound manner
- How to capture RAM from a physical device
- How to capture RAM from a virtual machine
Luckily I have already covered this in a helpful guide that can be found here.
If you are already comfortable with the above topics then let's get started with Volatility!
How to Install Volatility
Before we start you need to be aware that there is more than one version of Volatility available, the latest version is Volatility 3 which when I refer to Volatility in this article I will be referencing Volatility 3.
Previous to Volatility 3, when using the tool to analyze a RAM dump you had to specify the OS of the machine that the RAM dump had been taken from in order for Volatility to work. This could often be time-consuming depending on the architecture of the device and whether a certain service pack had been installed or not.
With Volatility 3 it will automatically work out the OS for you and means you can get started analyzing the RAM you have captured straight away.
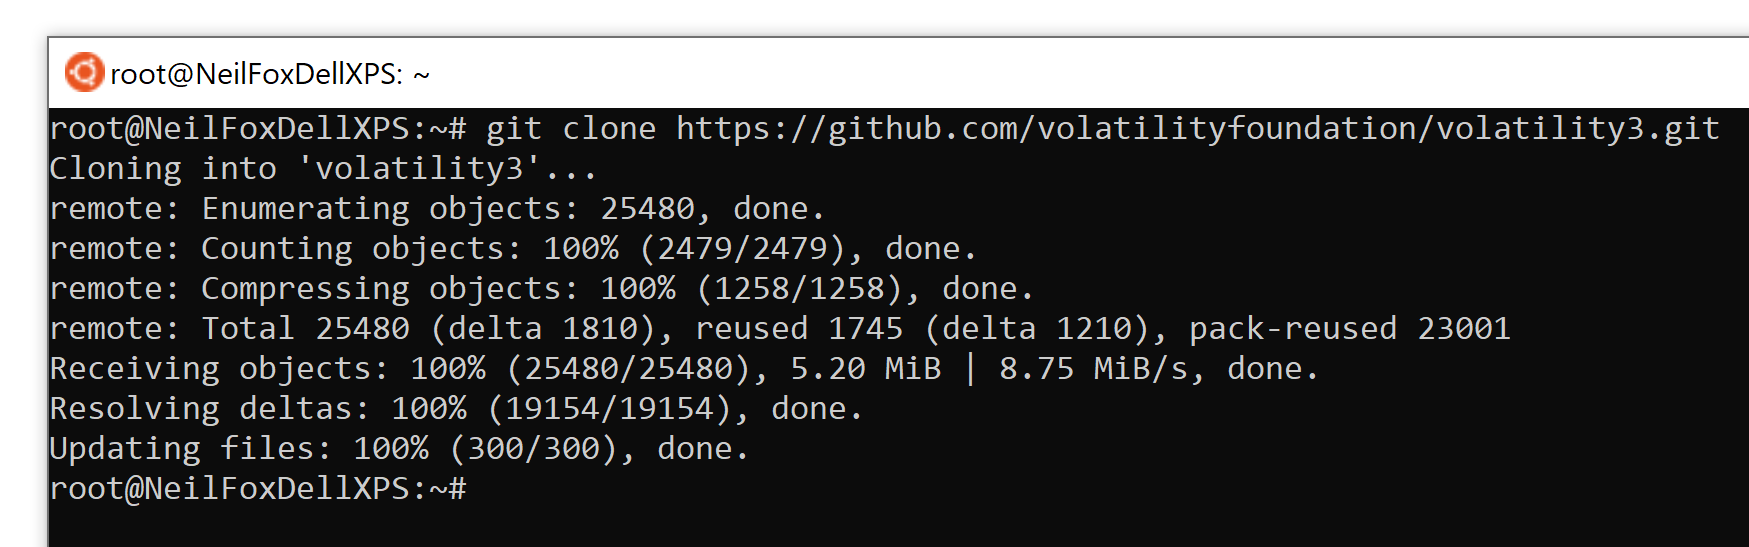
To download the latest version of Volatility use the following command:
git clone https://github.com/volatilityfoundation/volatility3.git
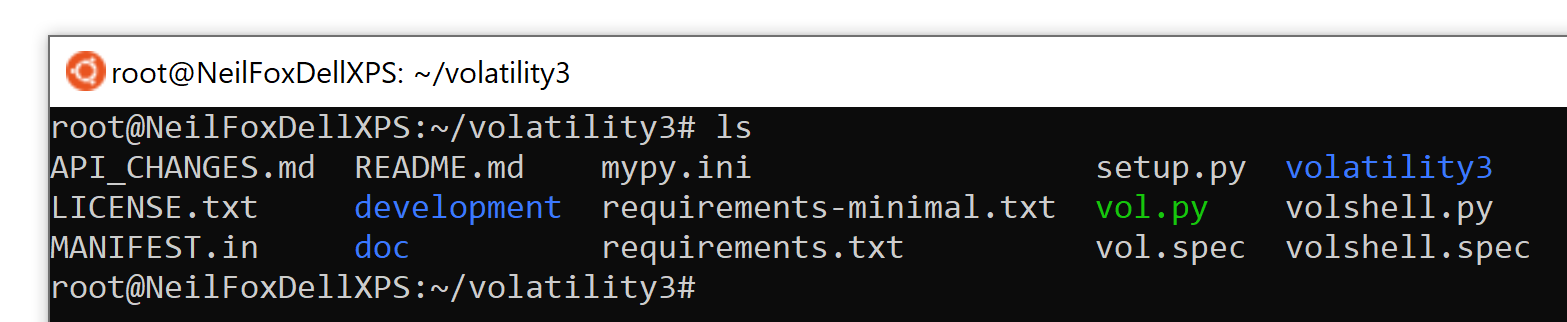
A folder called ‘volatility3 will now have been created, navigate to this location and a number of files will be listed.
Install the required dependencies so that Volatility will run without any issues.
pip3 install -r requirements.txt
Volatility should now be successfully installed, to check the tool is installed correctly use the following syntax to launch the help file:
python3 vol.py -h
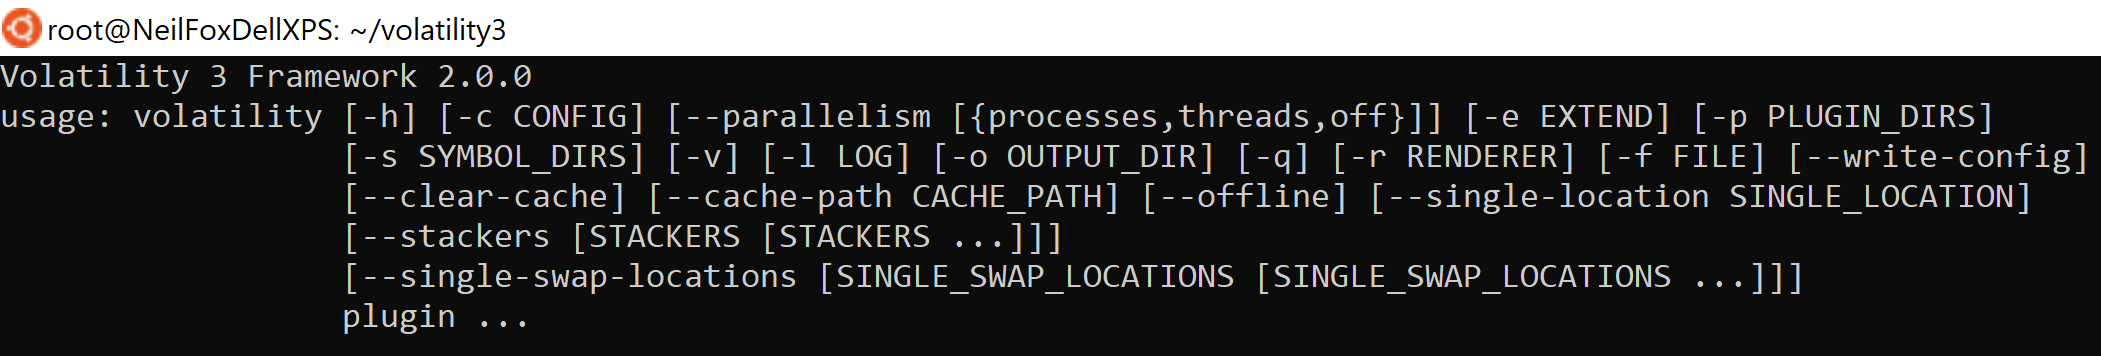
You’re now ready to begin using Volatility!
Identifying Malicious Processes
The first thing I like to do when I have received a RAM dump from a potentially compromised device is look at what processes were running on the device when the RAM dump was captured.
I’ve mentioned this in previous articles, but one saying that has always stuck with me is “malware can hide but it must run”. Looking at the running processes of a device is always a great way to try and identify any malware that may be running on the device.
pslist
There are a few commands in Volatility that can be used for analyzing running processes, the first one I use is ‘pslist’.
python3 vol.py -f <filename> windows.pslist
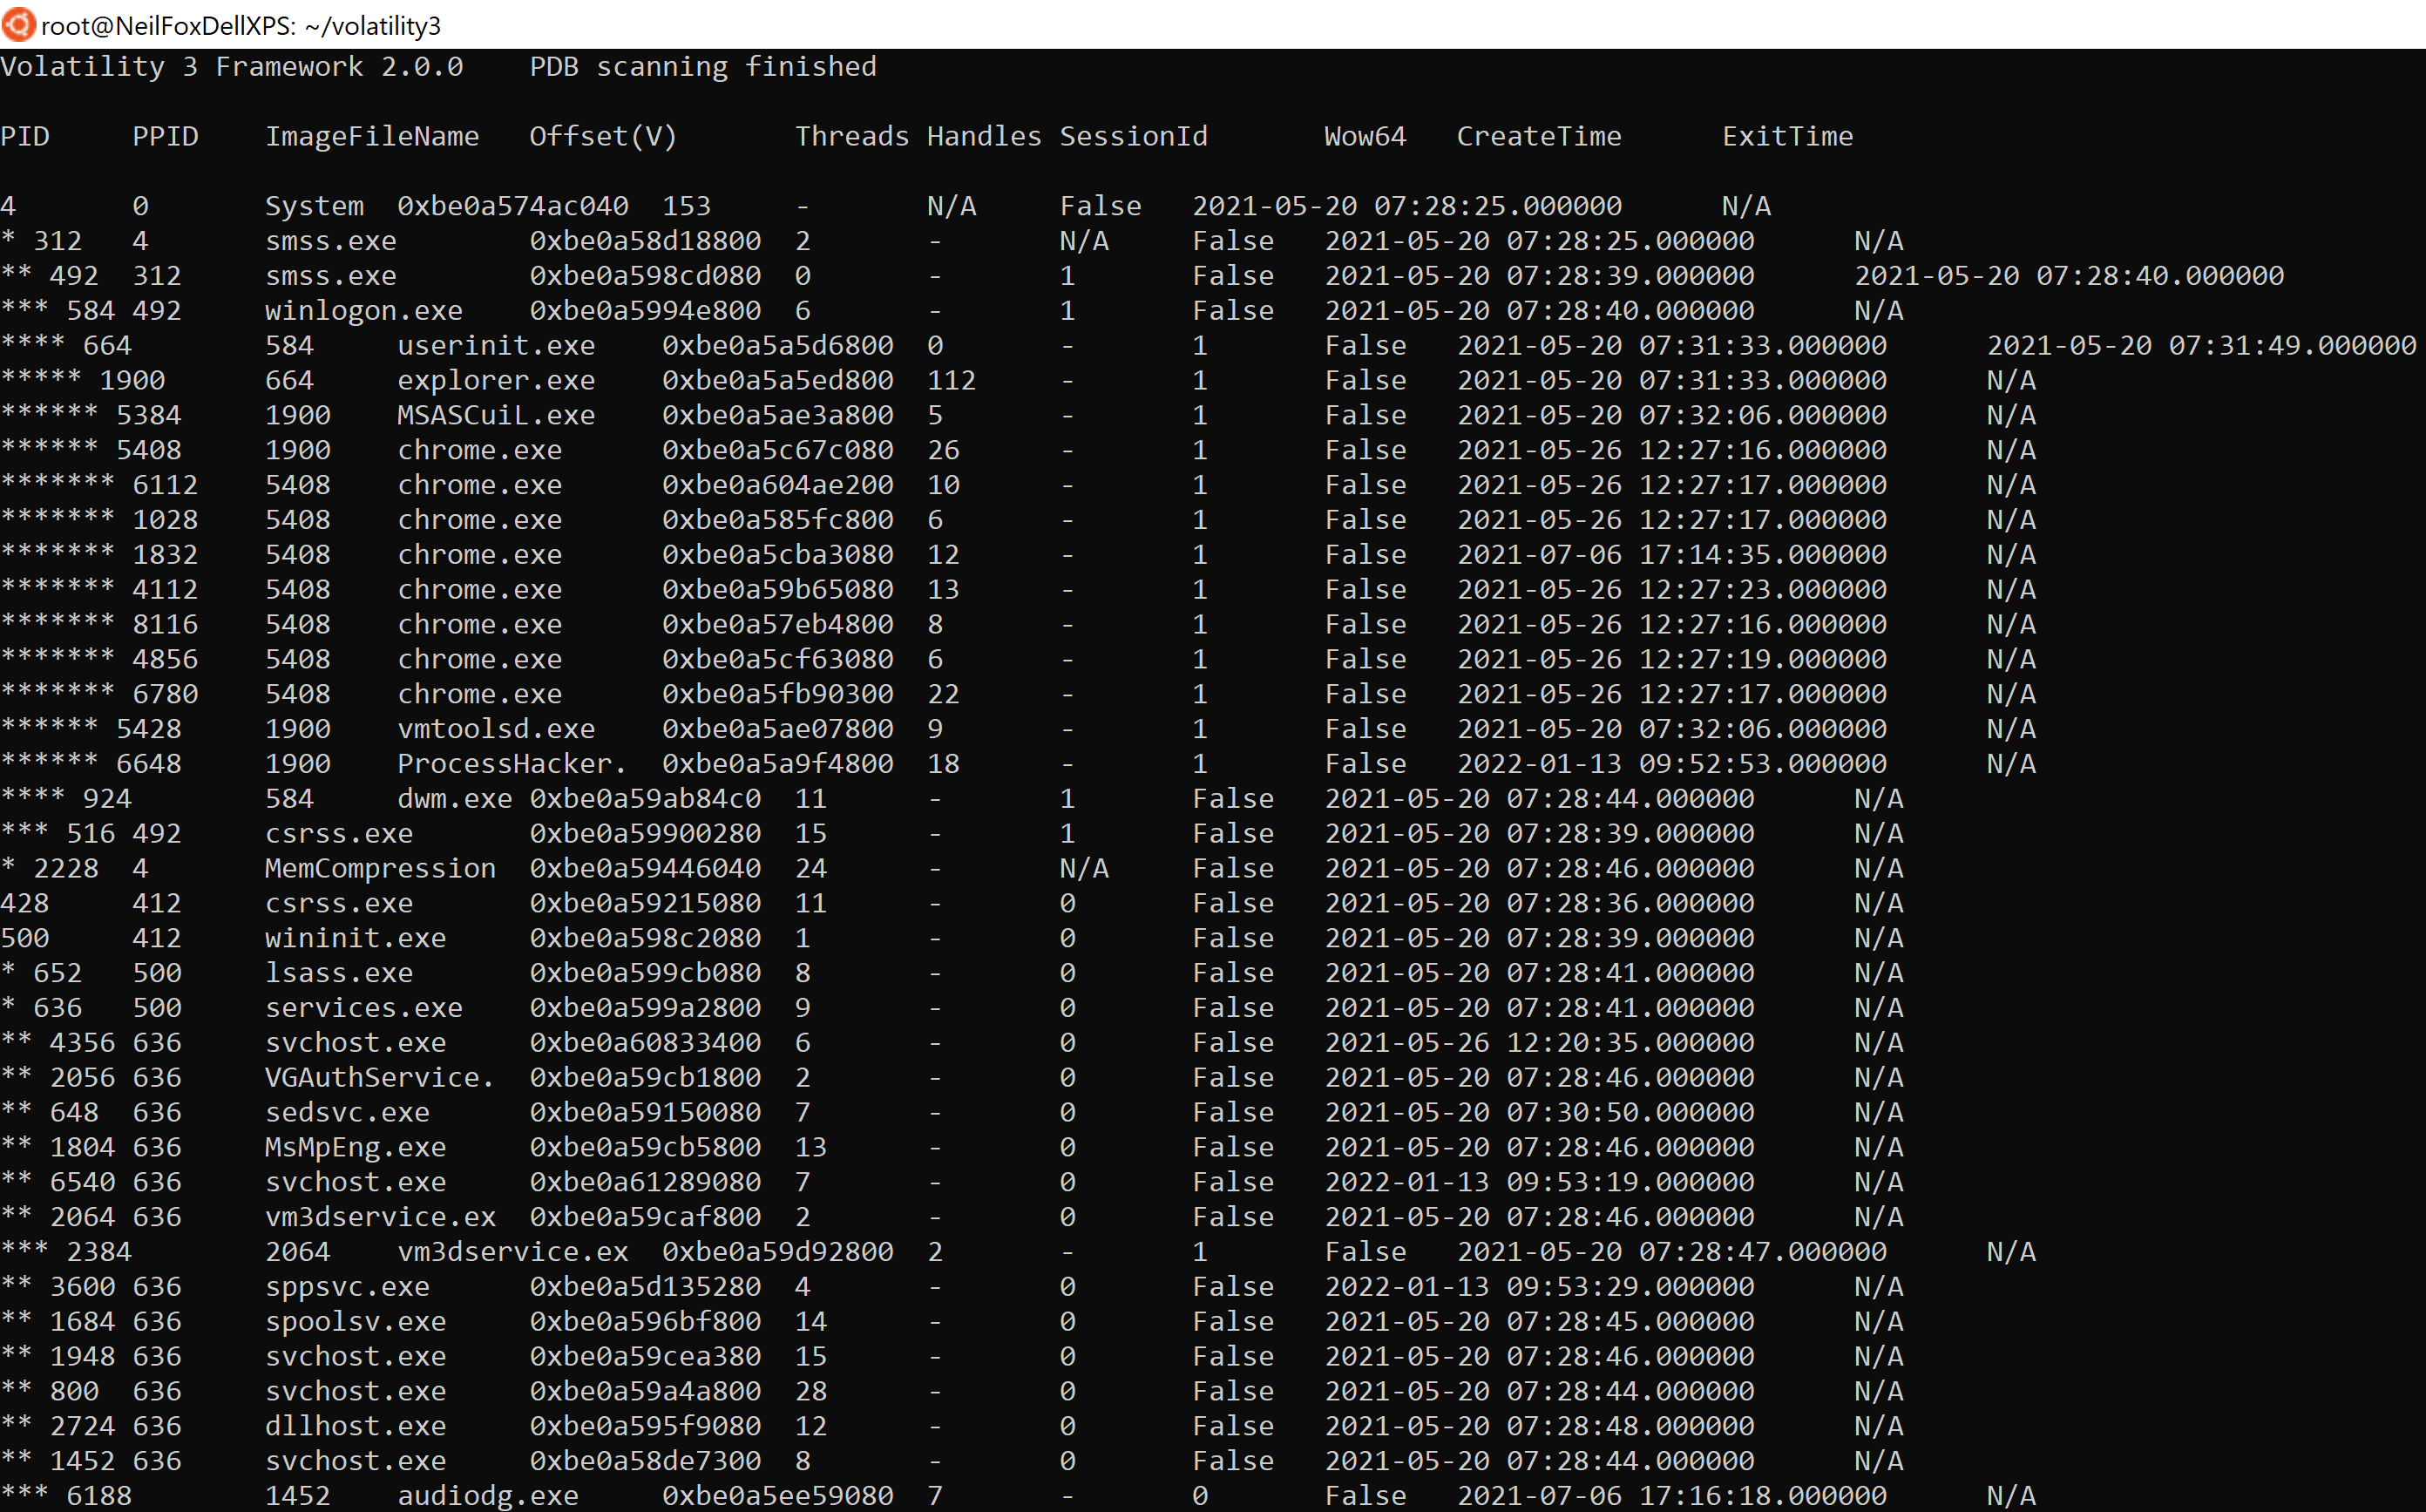
The above command will produce the following output:
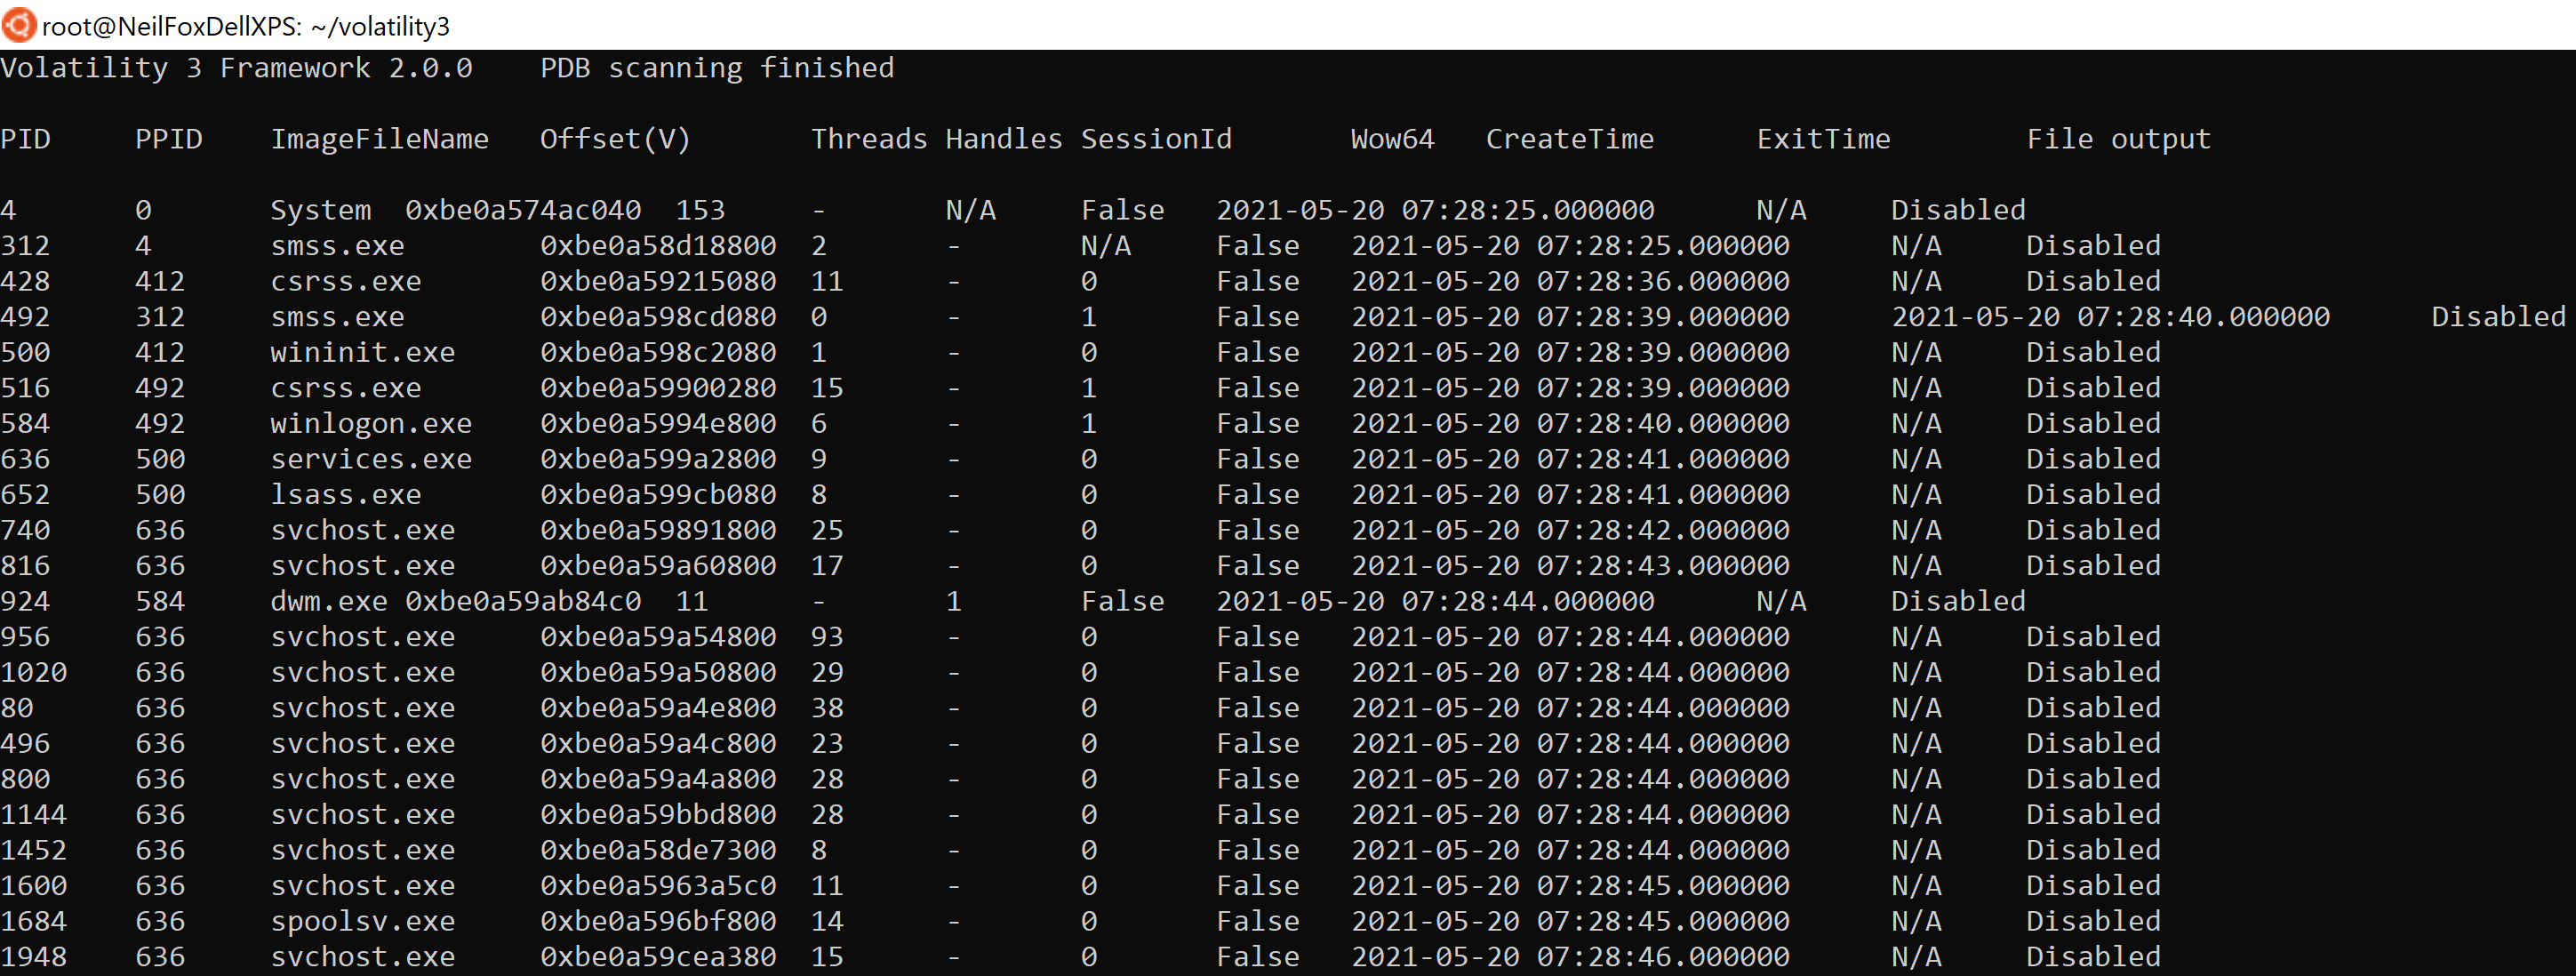
In the above image, we can see the output delivered from using pslist, when running these commands there may be a large amount of data produced so it may be worth using the following syntax to tab through the output or dump it into a text file, this can be done for any command in Volatility.
python3 vol.py -f <filename> windows.pslist | less
python3 vol.py -f <filename> windows.pslist > output.txt
Below are the keys headers from ‘pslist’ that you will need to understand when you begin using the tool:
- PID - Process ID number
- PPID - Parent process ID number
- ImageFileName - Name of the running process
- Offset - Hexadecimal value representing the location in memory the process is running
- CreateTime - Time process started
- ExitTime - Time process ended
Using this function I like to just take a look at the process names and see if there is anything that jumps out at me. If there is anything that catches your attention then simply google the name, you should be able to quickly understand if it is something that looks legitimate or requires further attention.
pstree
Once I have taken a look at the process names I then like to get an idea of what process spawned another process. This makes it easier to spot suspicious process activity as you can see what process launched ‘cmd.exe’ or ‘powershell.exe’ for example and see if this looks like legitimate activity or not.
Another reason I like using ‘pstree’ is that attackers will often name the running process of their malware after legitimate Windows processes such as ‘svchost.exe’. This allows the malware to hide in plain sight as it doesn't stand out amongst the numerous other Windows processes
Using ‘pstree’ is a great way to spot these malicious processes masquerading as legitimate Windows processes. Windows processes will always run from set locations on disk and their parent process tends to be a set process. For example ‘taskhostw’ will always run from ‘%systemroot%\system32\taskhostw.exe’ and its parent process will always be ‘svchost.exe’. So if you spot ‘taskhostw’ running from any other location or with a different parent process then it is definitely something you want to take a closer look at.
python3 vol.py -f <filename> windows.pstree
The image below shows the output of ‘pstree’, note that the output of the ‘PID’ has column has changed slightly.
The order of the ‘PID’ column is now sorted by a process and its associated child processes. However to make the visualization clearer for the user, each child process is assigned a ‘* before its PID’, each subsequent child process receives an additional ‘*’ prefixed to the PID.
The image below shows that the ‘System’ process has spawned ‘smss.exe’, which has spawned another ‘smss.exe’, which has spawned ‘winlogon.exe’ and so on.
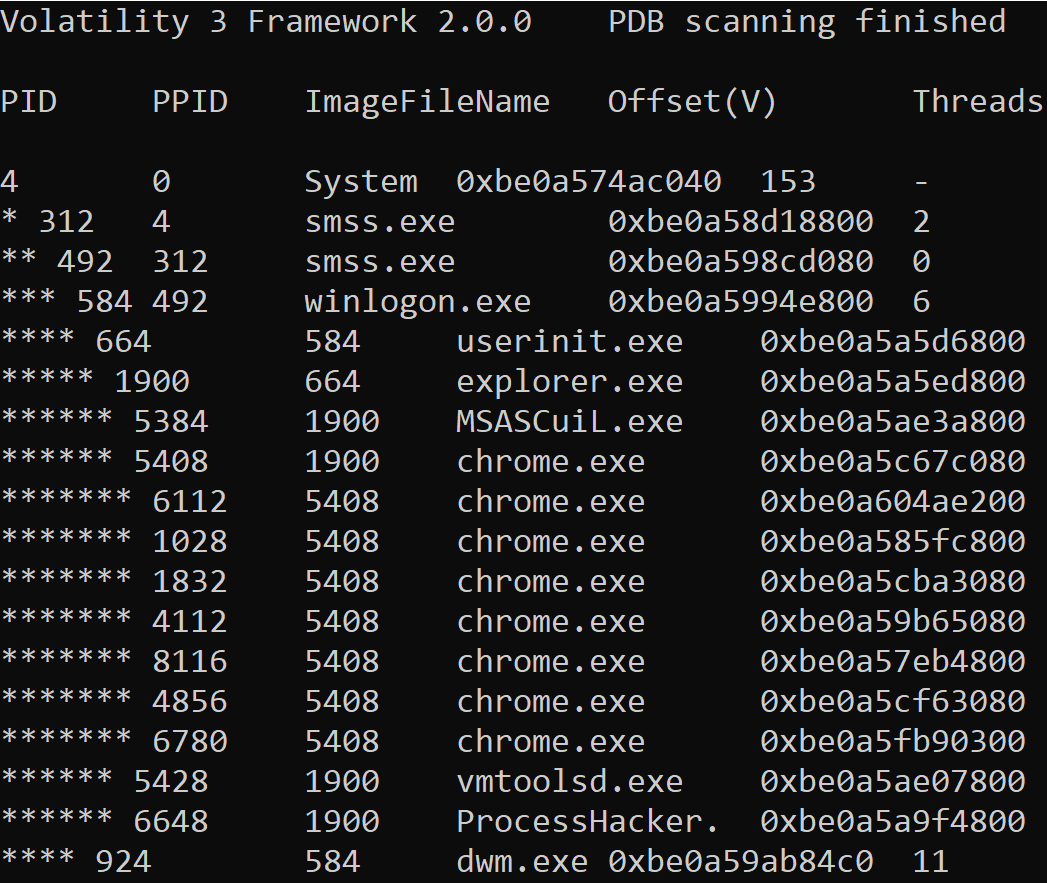
This is great for an incident responder as it makes it easier to see what process activity was occurring on the box and identify any process activity that could be potentially malicious.
Identifying Malicious Network Connections
When a RAM dump is captured any network connections at the time the capture was taken will also be stored within the captured memory. This is is great for incident responders as any malicious network connections can be identified such as the source port, destination IP, destination port, and the process that the network activity relates to.
netscan
To view the network connections associated with the RAM dump that is being analyzed use the following command:
python3 vol.py -f <filename> windows.netscan
The following information will be displayed from running this command:
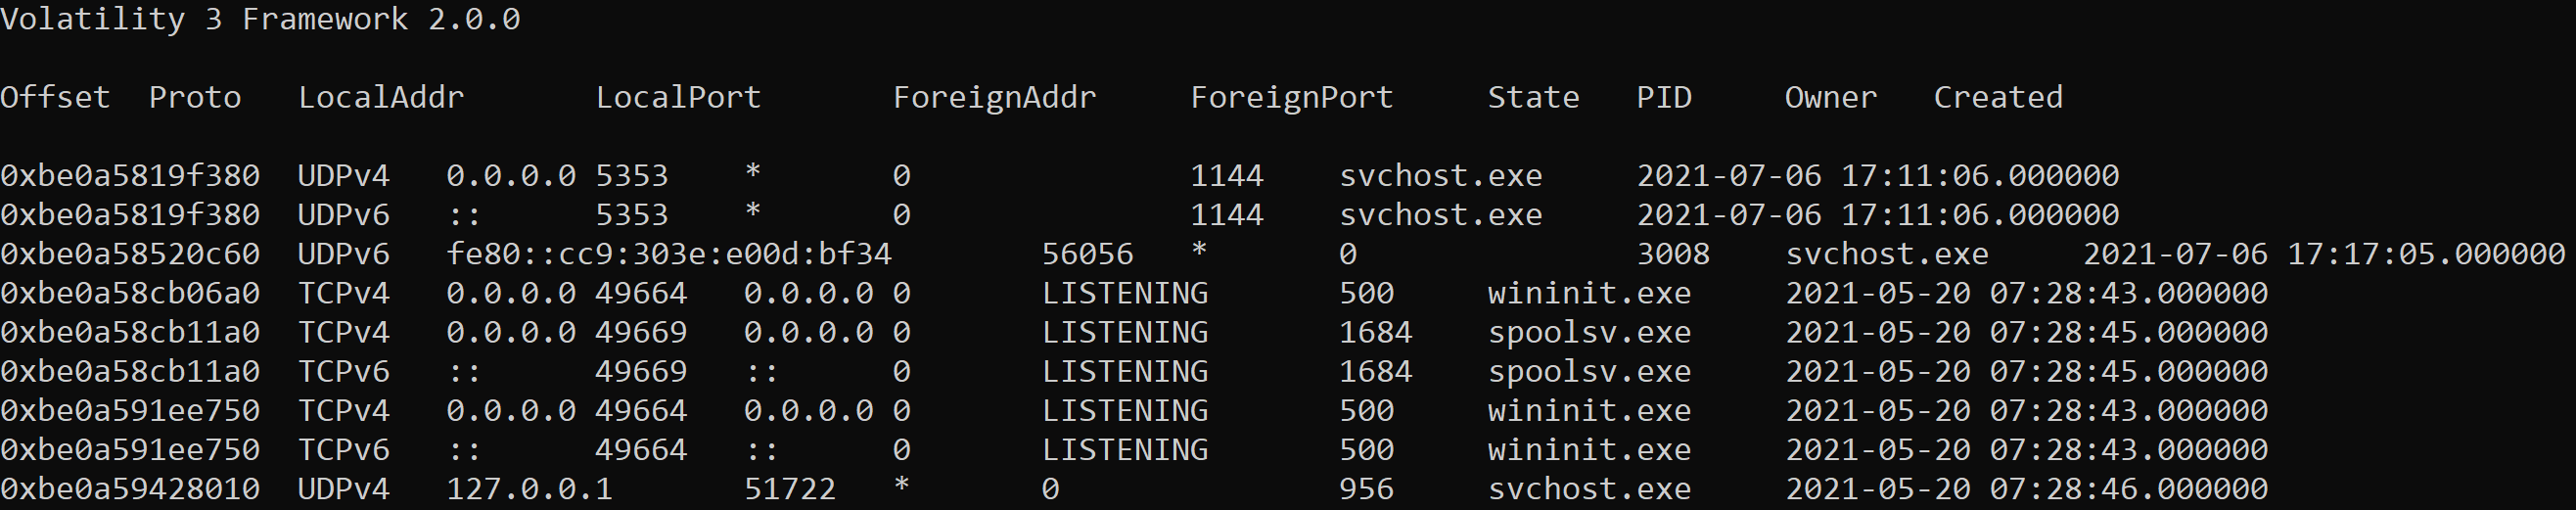
The output of netscan is made up of 10 columns:
- Offset - Location in memory
- Proto - Network protocol used by process
- LocalAddr - Source address of network connection
- LocalPort - Source port of network connection
- ForeignAddr - Destination address of network connection
- ForeignPort - Destination address of network connection
- State - State of network connection i.e. established, closed or listening
- PID - Process ID of associated process
- Owner - Account associated with process
- Created - Time network connection has initiated
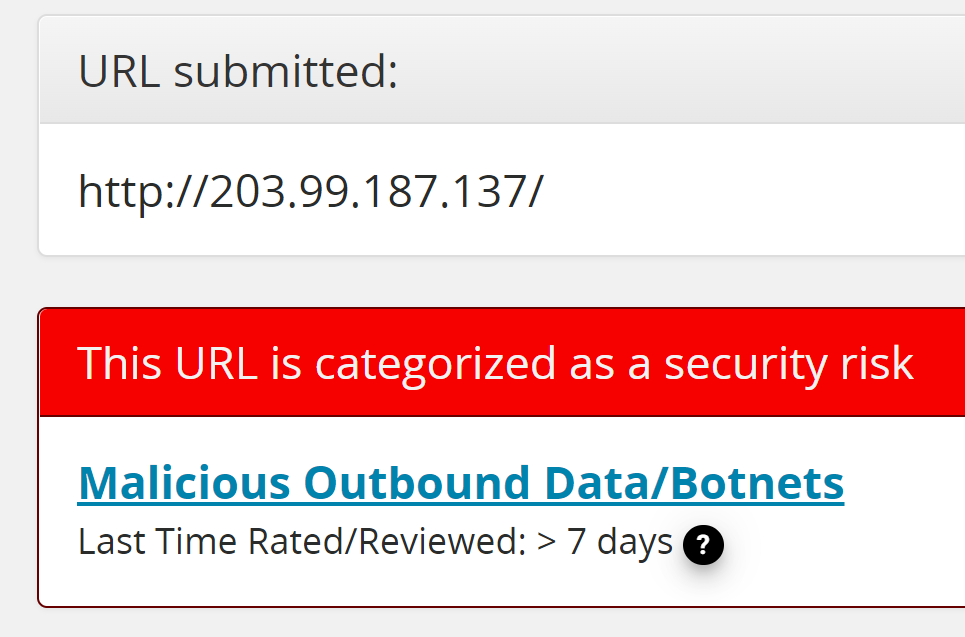
The image below shows some network connections that have been generated by a process called ‘smsfwder.exe’.
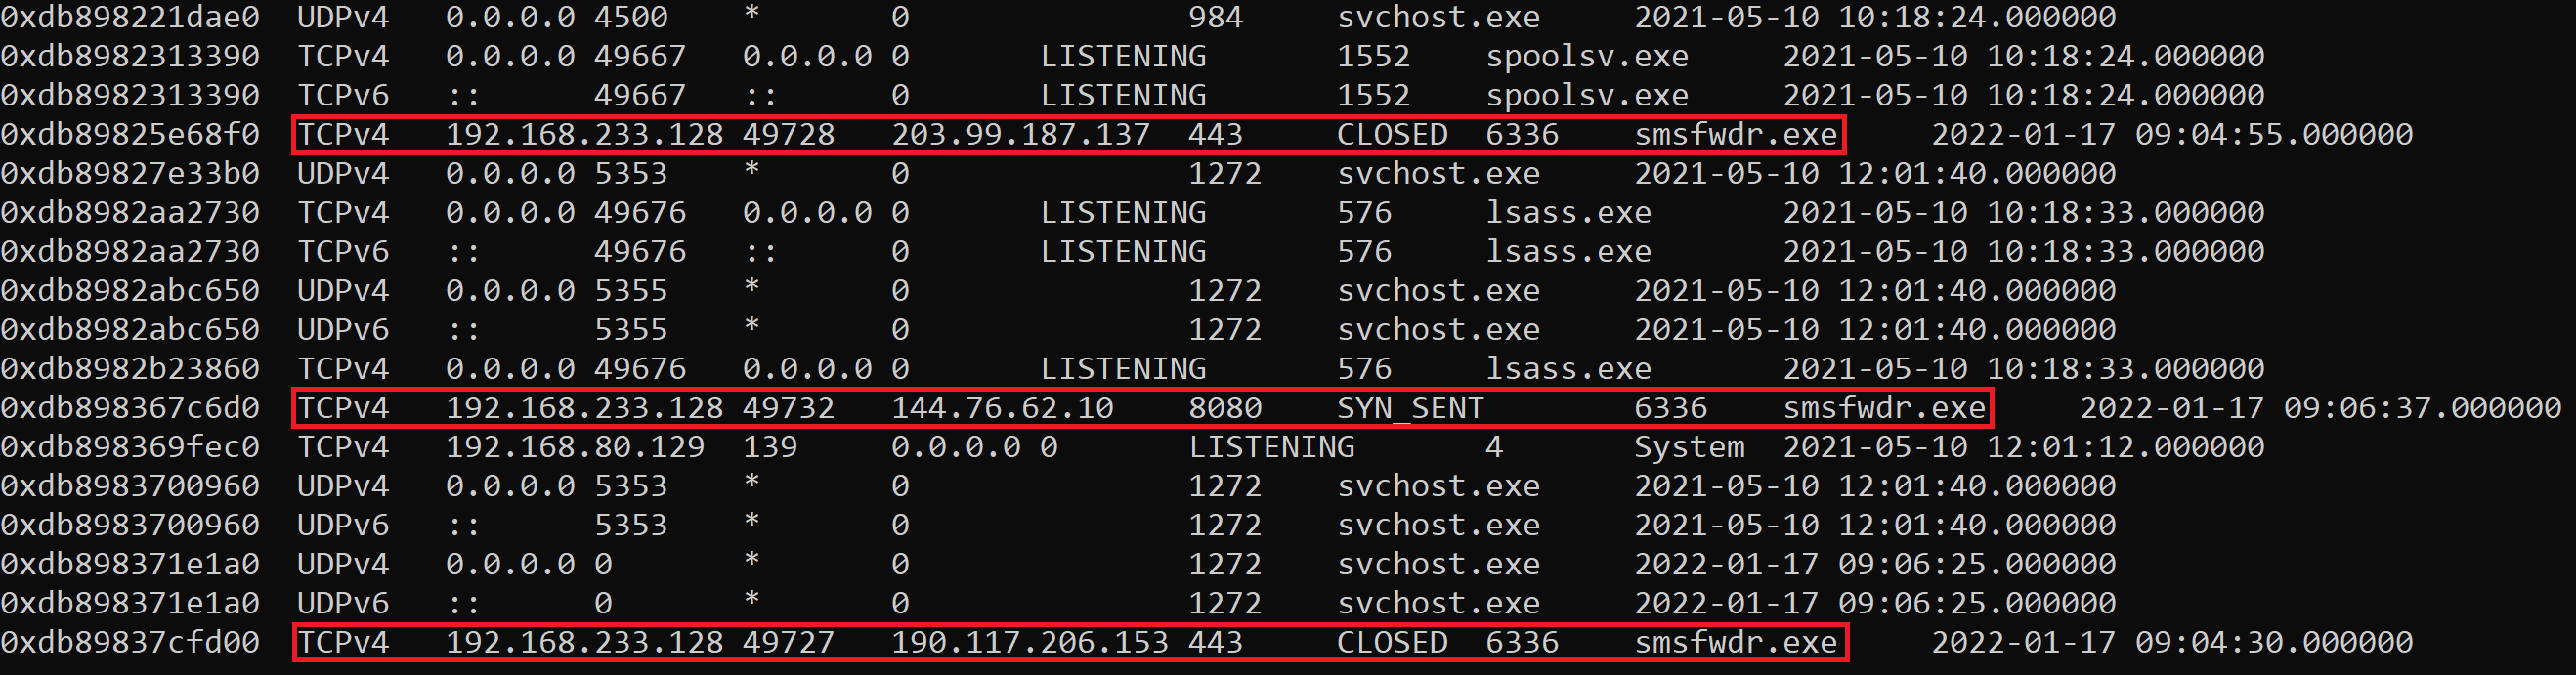
Volatility has identified three connections to three different IP addresses communicating over ports 443 and 8080.
Reviewing each IP using Symantec Site Review confirms that this activity is related to a known malware command and control server.
These IOC’s can now be used to search for other devices that may be compromised and need isolating from the rest of the network as part of a company’s incident response plan.
Identifying Injected Code
Malware is often packed so that the code written by the malware author is obfuscated, the bad guys have taken time to write some malicious code and don’t want it to be an easy task for somebody to take a quick look at the malware and in a short space of time identify what it does and how to stop it.
Packed malware is essentially ‘wrapped’ with a layer of code, this additional layer hides the code the malware author has written and it’s this obfuscation technique that is known as malware ‘packing’.
Because of this when a piece of malware is packed it will need to unpack itself, it does this in memory which is great for Volatility as that is exactly what the tool is designed to analyze!
If this is a new concept then I recommend reading this article I have previously published which is all about unpacking malware. The key details you need to know is that in order to unpack itself, the malware will create a child process and inject the unpacked executable/unpacked malware into this new process.
malfind
Using Volatility to look for injected code is done by using the ‘malfind’ feature. This displays a list of processes that Volatility suspects may contain injected code based on the header information displayed in hex, the permissions, and some extracted assembly code, just because a process is listed in the output it doesn't mean the process is 100% malware.
The output of ‘malfind’ is displayed below.
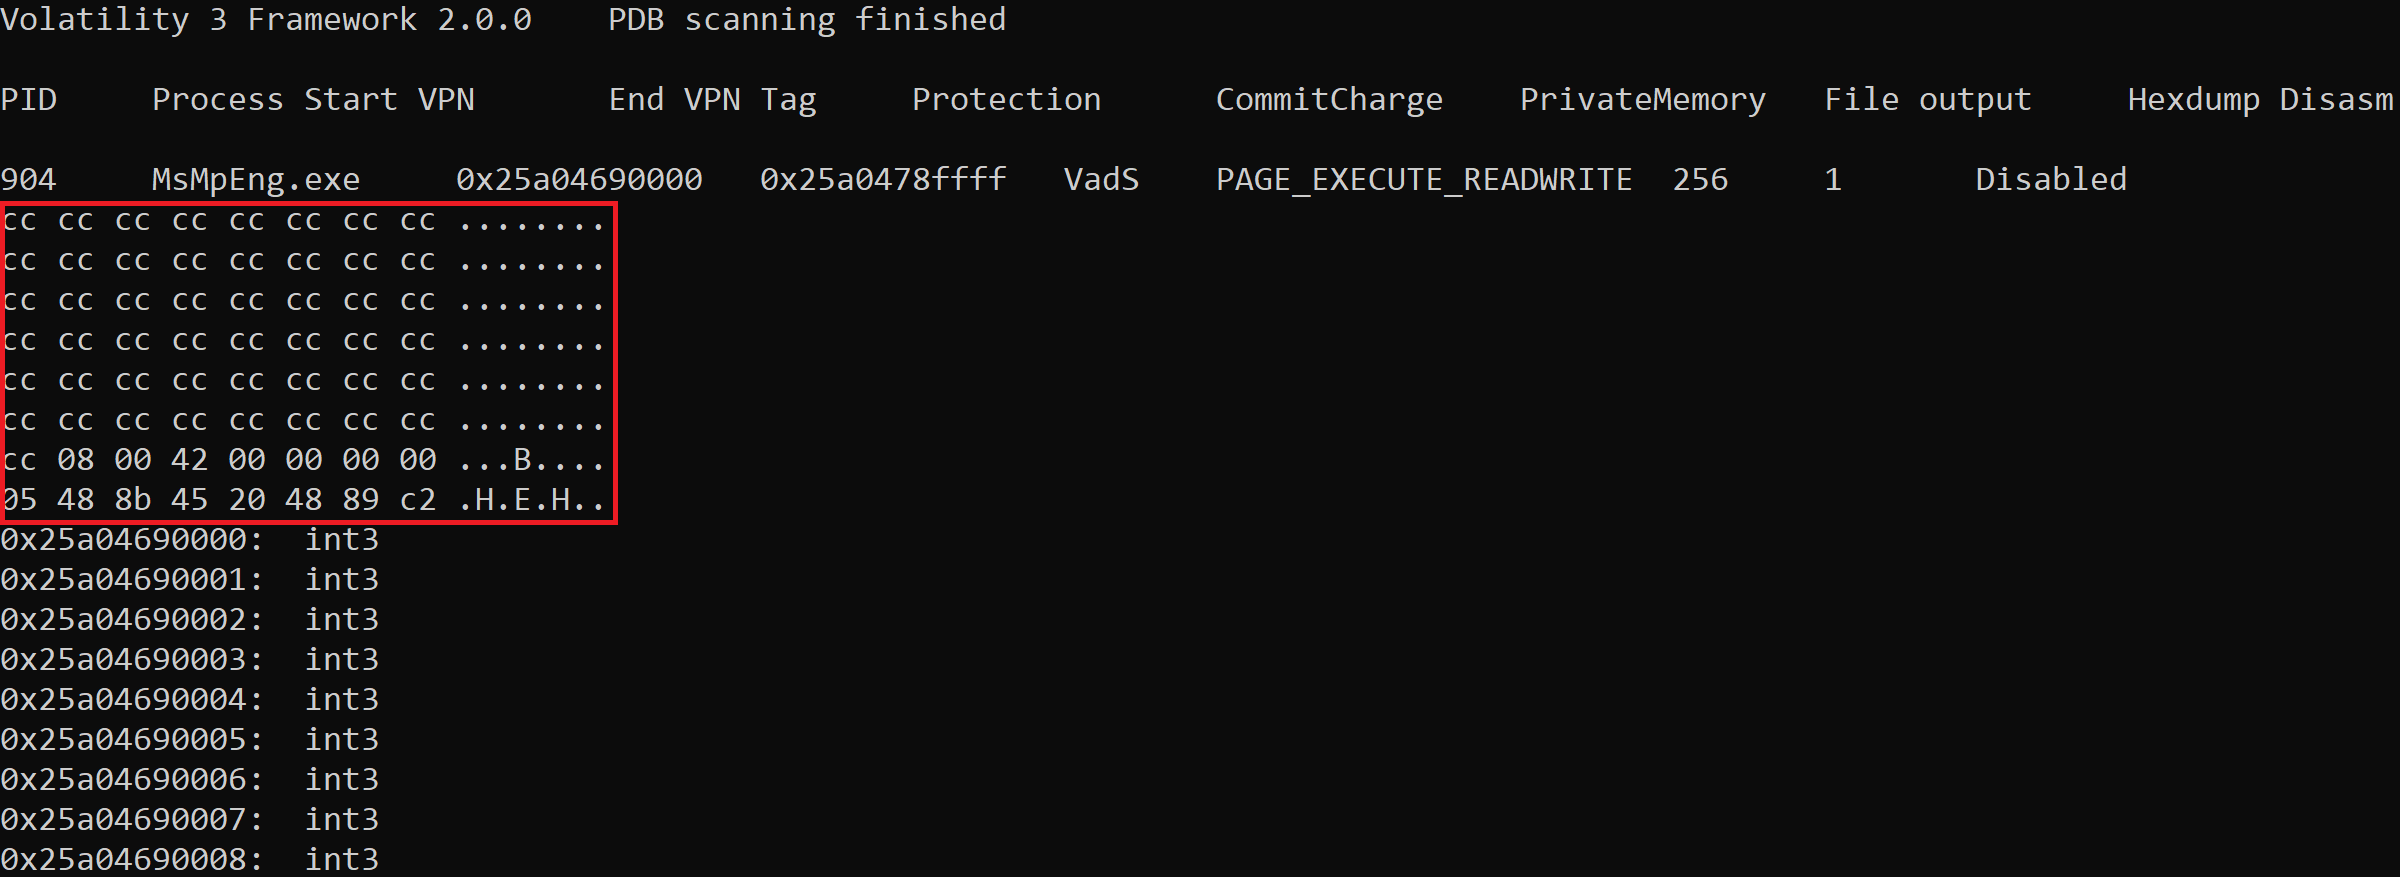
The key points you need to understand are the PID, the process name, the protection, and the area highlighted in red.
The PID and process name are self-explanatory, the ‘Protection’ relates to the output ‘PAGE_EXECUTE_READWRITE’. This means the process has execute, read and write permissions, this is common for malware as it needs to be able to execute itself or other executables it downloads/drops, it needs to read files on the device it has compromised and it needs to be able to write files to disk. So any processes captured that have these permissions will be displayed in the ‘malfind’ output.
As this serves as an introduction the simplest way to get started with ‘malfind’ is to focus on the process name and the area I have highlighted in red.
This displays the start of the data contained within the process represented in hexadecimal and next to that the same values in ASCII. If you have read any of my previous articles, I have used tools such as x64dbg and PeStudio to display the header of a Windows executable which is a common file type used for malware.
The header of a Windows executable in hex will always start with ‘4D 5A’ which represented in ASCII is ‘MZ’. Below is a piece of malware that I have opened in HxD which is a hex editor, by using this tool I can display the file header that contains this information.
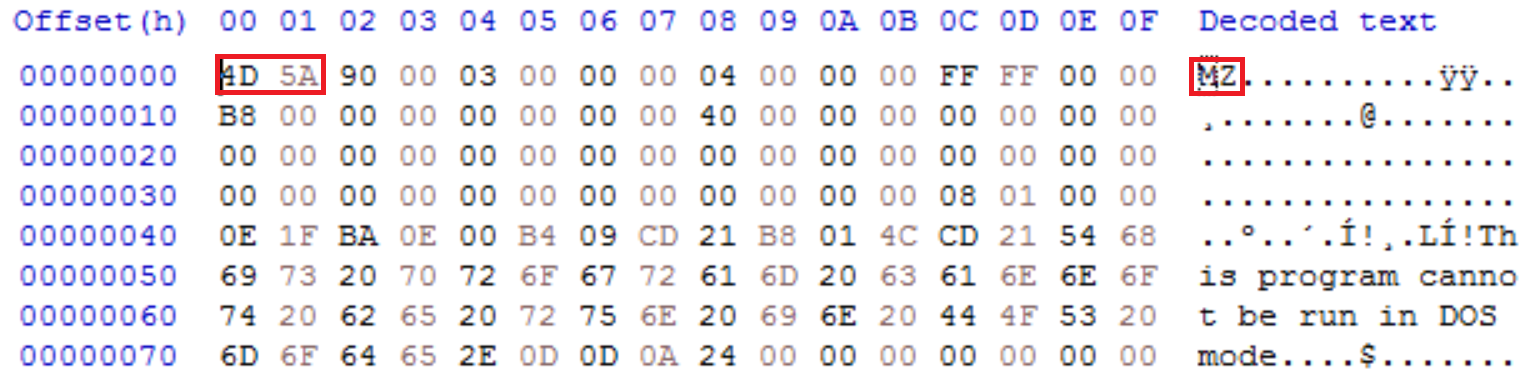
As an incident responder when using ‘malfind’ if you see these values within a process then it is very likely you have identified a piece of malware that has injected itself into another process.
procdump
Using the commands covered in this article should put you in a good position to start identifying potential malware running in memory on a device. Using ‘netscan’ I was able to identify a process named ‘smsfwder.exe’ that was making some malicious network connections to known C2 infrastructure. As part of my investigation using Volatility, I can extract this process for further analysis using a feature called ‘procdump’.
python3 vol.py -f <filename> -o <location to dump process> windows.dumpfiles –pid <PID>
This will extract the executable and all of the associated DLLs. In the image below I have extracted the process to a folder named ’procdump’.
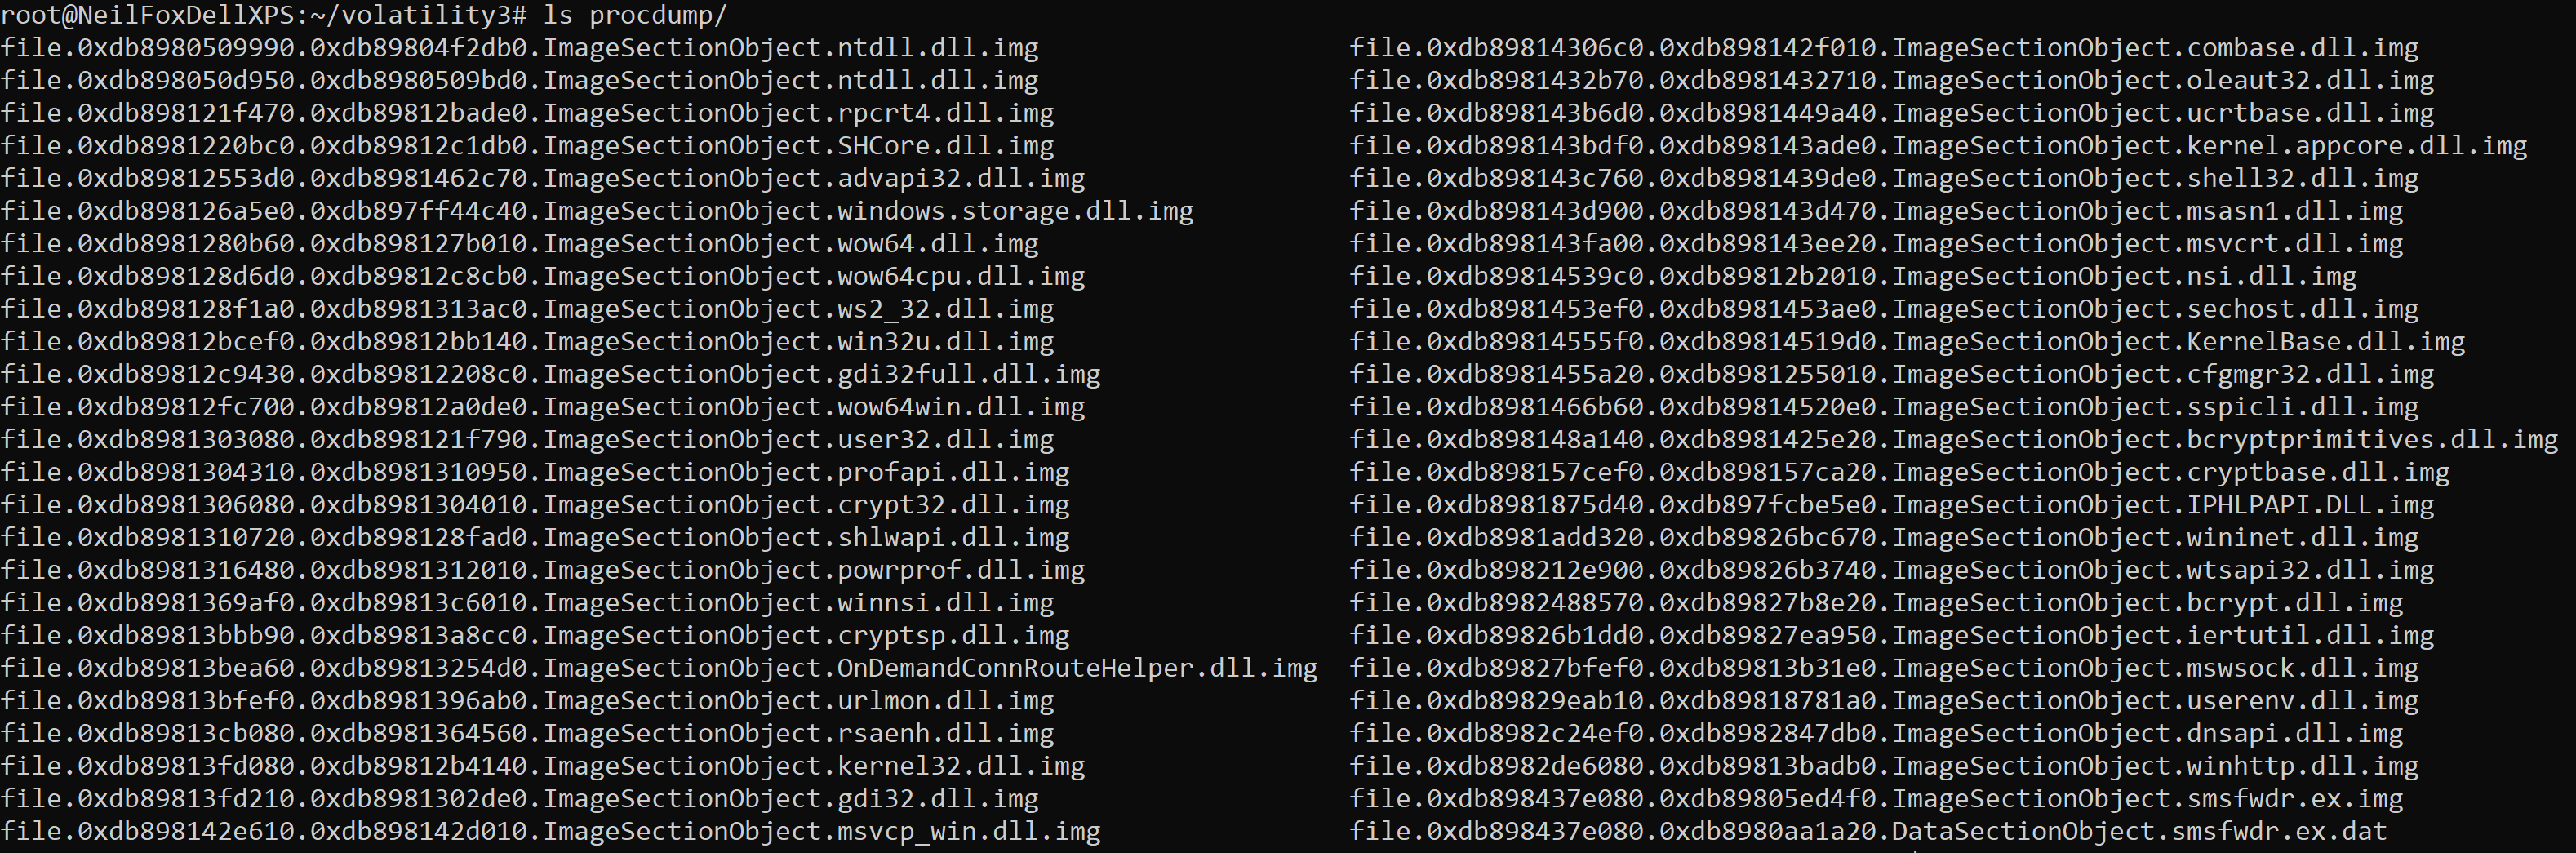
This is useful as you can then try and extract additional information from the dumped process by performing some simple checks such as running the ‘strings’ command against the dumped process to see if you can identify any additional IOC’s such as IP addresses, filenames, persistence locations etc.
Final Thoughts
This article should give you a strong foundation and a clear understanding of how useful a tool Volatility is for incident response. However, it's not a silver bullet, remember that you are only analyzing what was running in memory when the RAM dump was captured. This makes it a great way to triage and start investigating a potentially compromised host, but if the malware wasn't running at the time the RAM dump was captured then you won't see any malicious activity, the same goes for any network connections.
Due to the scope of the tool I have only managed to scratch the surface of using the tool, however, I strongly recommend putting some time in, playing around with the tool, and adding it to your IR toolbelt. One resource that I recommend is a Volatility cheat sheet that was put together by Ashley Pearson that will show you how to use the features I haven't been able to fit into this article.
If you are interested in finding out how Varonis can improve your organization's security posture then be sure to take a look at how Varonis can help you fight insider threats and ensure your company’s data is safe.


-1.png)