
Every second, trillions of 1’s and 0’s zip through fiber-optic links, skip from continent to continent through undersea cables and wirelessly bring users all over the world to the Internet we know and love. But have you ever wondered exactly how those bits of data move from one place to another? Traceroute, a tool you may already have, can provide some insights by tracing the path between your computer and a target destination. In this post, we’ll look at what traceroute is and how traceroute works, learn how to run traceroute on several different platforms, and how to read a traceroute output.
What is traceroute?
Traceroute is a simple yet clever command-line tool for tracing the path an IP packet takes across one or many networks. It was originally developed for UNIX-based platforms, but is now included in most operating systems, with the Windows implementation being known as “tracert”. The output of these commands is also frequently referred to as a traceroute. Ask for help with poor streaming video performance, for example, and your ISP might ask you for a traceroute.
What is the purpose of traceroute?
Traceroute is used primarily for diagnostic purposes, but it can be a fun tool to learn about networking or simply to satisfy some nerdy curiosity. System administrators and network engineers can use traceroute to see how traffic flows within an organization, and identify any irregular or sub-optimal paths. Externally, traceroute can display the path of a packet as it traverses many different networks, and in some cases even reveal the different cities or geographic regions traffic flows through. Attackers could potentially use traceroute to map out a target’s network, which is why the types of packets used by traceroute are frequently blocked or filtered at the perimeter of corporate networks.
Most implementations of traceroute also display the time it takes to reach each “hop” between the source and destination. This is extremely useful when hunting down the root cause of dropped traffic or performance issues. During one episode of sporadic connectivity from my home office, I was able to see from traceroute results that my ISP was dropping many packets and inconsistently routing others through strange, geographically distant paths. Hours later, the ISP announced a regional fiber optic cable had been cut by a contractor.
How traceroute works in five steps
Traceroute is actually a bit of a hack, in that it leverages a field in Internet Protocol (IP) packet headers that was never really intended for path or route tracing. The IP standard mandates a Time-to-Live (TTL) value for each IP packet, which acts as a kind of self-destruct mechanism to keep undeliverable packets from endlessly circulating around the Internet. Each router in a path is expected to decrement the TTL value by one before sending it further down the line. Once the TTL hits zero, the routing process comes to a screeching halt, and the last router to have processed the packet will send back a “Time to live exceeded” message.
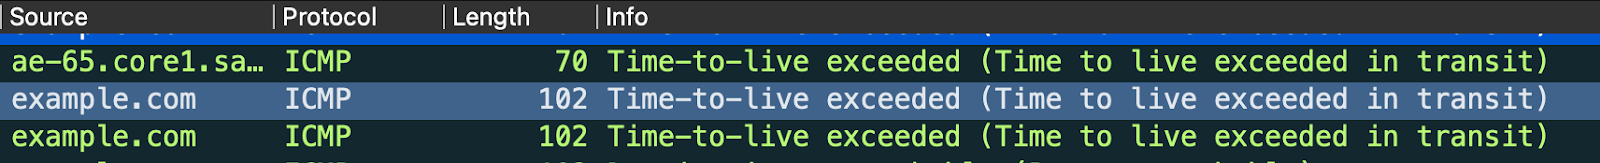
Exceeding a TTL value isn’t desirable for normal data packets, which is why a typical packet will have a value ranging from 64 all the way to 255. But what would otherwise be a frustrating error message is actually a key part of how traceroute works. By manipulating the TTL field, traceroute and similar programs can trigger TTL exceeded messages from each hop along a given path. Here’s how it works:
- The user invokes the traceroute (or tracert) command and specifies a target host. If the host is specified in the form of a domain name, traceroute will attempt to resolve it.
- Traceroute sends a data packet towards the target with the TTL value set to “1”. The first router in the path will decrement the value by 1, which should trigger a TTL exceeded message that gets sent back to the host on which the traceroute program is running.
- With details of the first hop in hand, traceroute will increase the TTL value to “2”. That first router in the path will still decrement the value by 1, but because the TTL will no longer drop to zero right out of the gate the packet can live on for one more hop. Once the TTL value does hit zero (in this case, at the second router in the path), another TTL exceeded message should be generated and passed back to traceroute.
- The process repeats itself, with traceroute increasing the TTL by 1 each time, until the destination is reached or an upper limit of hops is hit. By default, the upper limit is 30 hops, but a different value can be specified when the command is run.
- When finished, traceroute prints all the hops in the path, along with the amount of time it took to each hop and back (this is known as the Round Trip Time).
By default, traceroute will send three packets to each hop in the path. The exact type of packet varies between implementations, and can also be changed with different flags, but this same basic methodology is used in all cases.
How to run a traceroute
Traceroute is available on a wide variety of platforms, from consumer operating systems to large enterprise routers. There’s not much variation in how traceroute works across these different platforms, but the syntax of the command can be a little different. Here’s how to run traceroute from several popular platforms:
How to run a traceroute on Windows
Microsoft’s implementation of the traceroute tool is slightly different from what you’ll find on Mac/Linux/Unix platforms. The most glaring difference is in the command itself: On Windows PCs, you’ll use the “tracert” command instead of typing the whole word. Here’s a step-by-step guide:
- Open a command-line prompt. You can do this by typing “command” from the Start menu, or by pressing the Windows Key+R and typing in “cmd”
- From the command-line prompt, type “tracert” followed by the hostname or IP address you’d like to trace to. To see the path to varonis.com, for example, we’d type “tracert varonis.com”. The tool should resolve a domain name to an IP address automatically.
- Wait a bit for the results. You should see the tool start to build results within a few seconds, but tracing the full path can take longer.
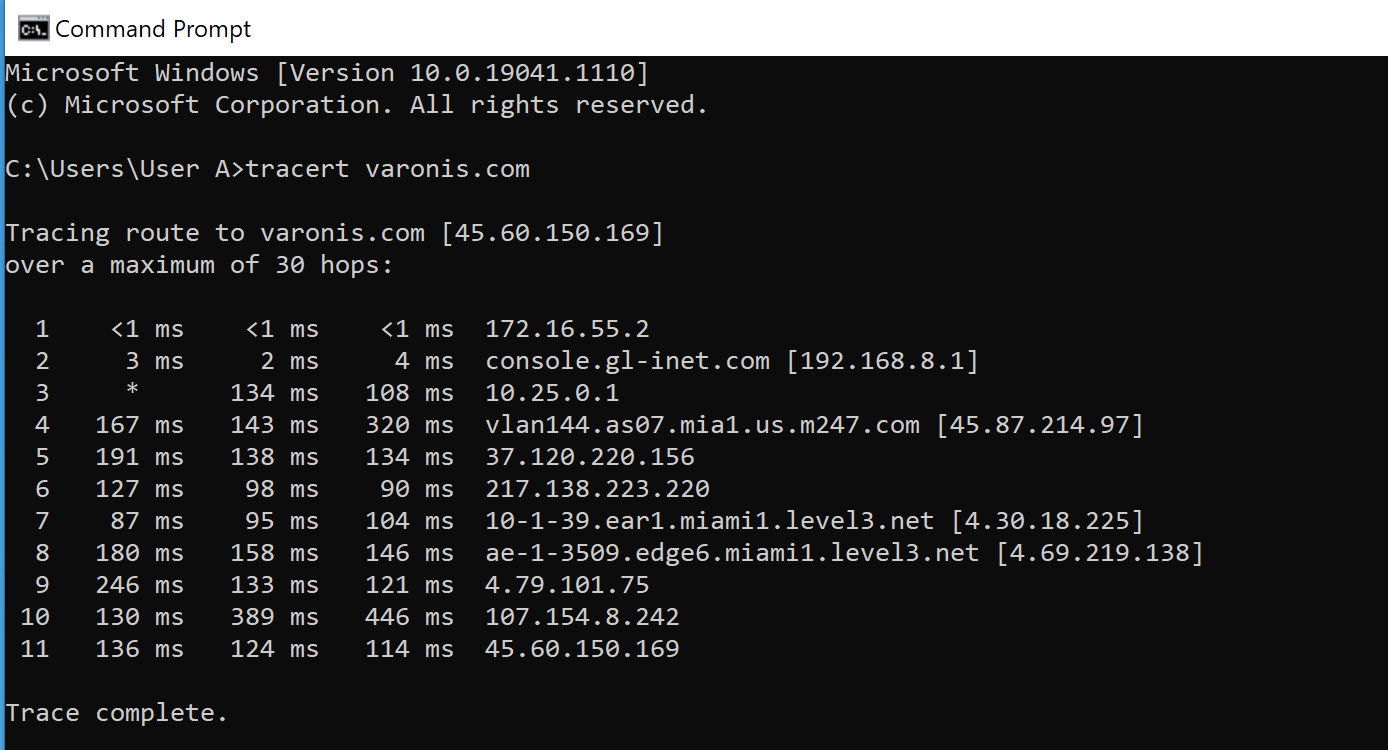
The example above shows how to run a traceroute on Windows 10, but the process should be no different for other versions of Windows.
How to run a traceroute on Linux
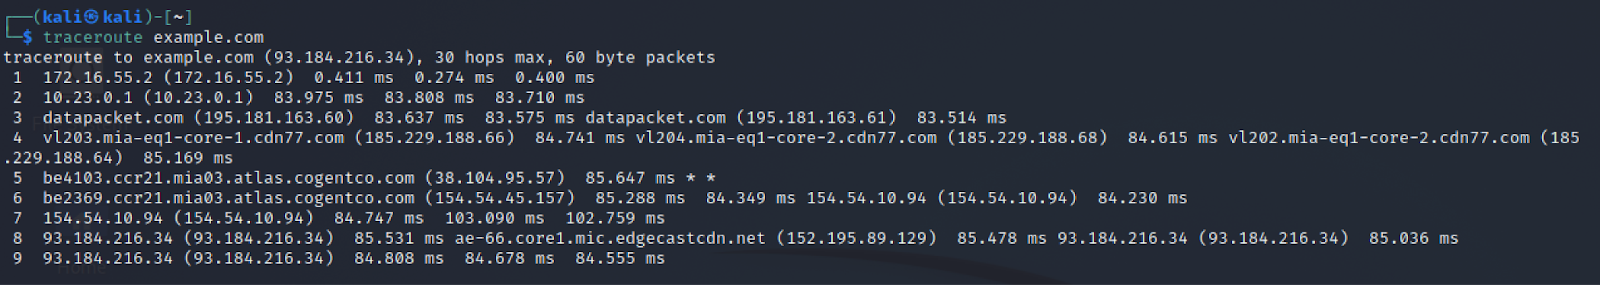
Many flavors of Linux come with traceroute pre-installed, although some distributions opt for similar tools like mtr and tracepath. In any case, you can generally obtain the “classic” traceroute using the yum (yum install traceroute) or APT (apt-get install traceroute) package managers. From there, the steps aren’t too dissimilar from Windows:
- Open your favorite Terminal Emulator. This step isn’t required if you’re running Linux without a window manager (GUI).
- Type “traceroute” followed by the hostname or IP address you’d like to trace.
- Wait for the trace to complete and review the results.
Here’s an example of a traceroute run from Kali Linux:
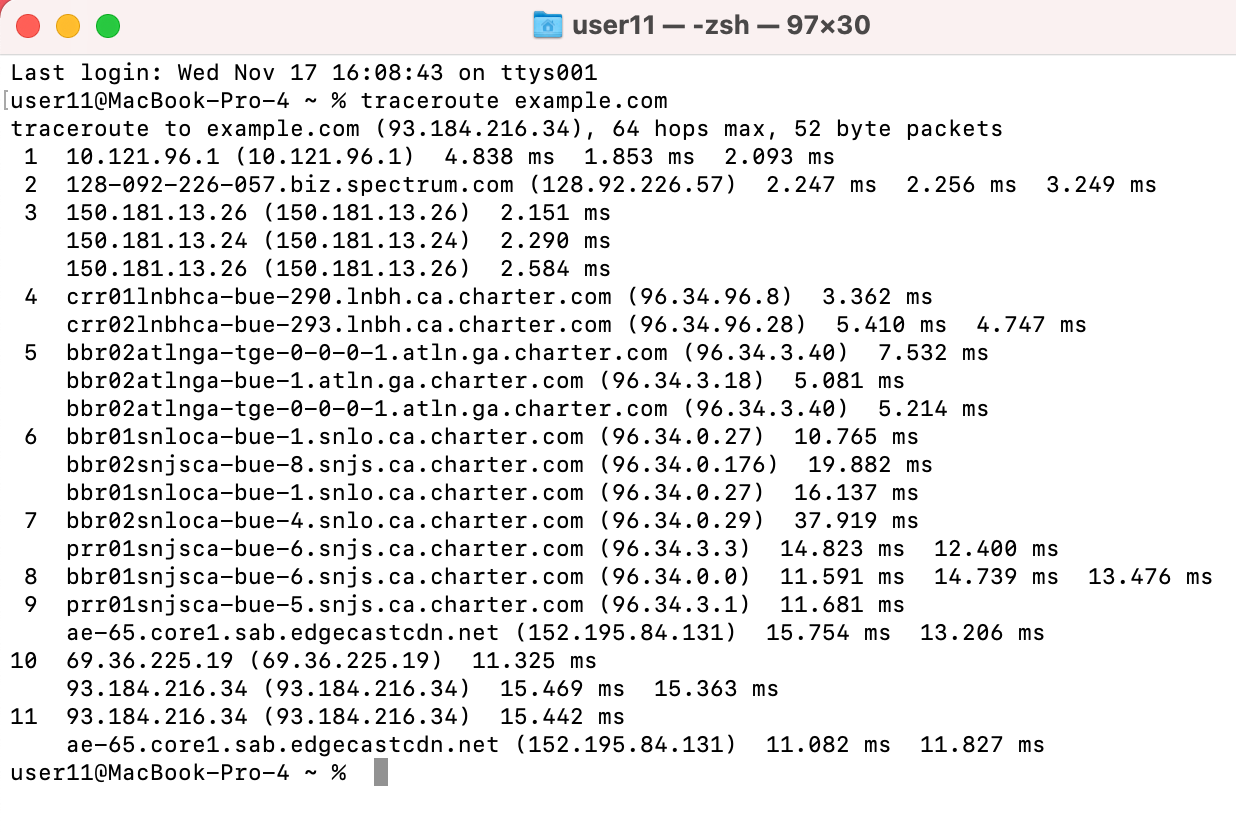
How to run a traceroute on Mac
Running a traceroute on Mac is virtually the same as running it on a Linux platform:
- Open the “Terminal” App.
- Type “traceroute” followed by the hostname or IP address you’d like to trace.
- Wait for the trace to complete and review the results.
You might notice that some of the defaults are a little different; a max of 64 hops, for example, instead of 30. You can easily change these settings using command line flags. Just check the official traceroute documentation using the “man traceroute” command.
How to read traceroute output
Now that we know a little more about how traceroute works, it’s time to start using it! If you’ve never used traceroute before, things might look a little intimidating at first. Once you learn how to read a traceroute output, though, you can quickly make sense of the results.
Each line of the traceroute output represents one “hop” in the path to a given destination. These hops might be listed as either an IP address or a hostname; traceroute will attempt to resolve the IP address of each hop back to a hostname and display that, if possible. The list begins with the closest router to your computer and ends at either the destination or the last point the traceroute made it to before hitting a maximum number of hops. To the right of each entry is a series of times measured in milliseconds (ms). This is the Round-Trip Time or the amount of time it took for the traceroute packets to reach that hop and receive a reply.
You might notice one or more lines of your traceroute output is listed only with an asterisk (*). This means that the program did not receive any response from the router at that hop. Some organizations choose to block or discard the type of packets that traceroute relies on, either by blocking them with a firewall or configuring routers to discard the packets instead of replying. Traceroute traffic is also considered low-priority; a busy router may process standard data packets rather than reply to your traceroute request.
For a traceroute taking place over the Internet, it’s likely you’ll see a path that traverses multiple networks, service providers, and geographic regions. Let’s look at a traceroute that runs from the East Coast of the United States all the way to Nepal in South Asia:
traceroute to nepal.gov.np (202.45.147.252), 64 hops max, 52 byte packets

 1  10.28.0.1 (10.28.0.1)  478.335 ms  76.807 ms  73.279 ms

 2  vlan156.as06.mia1.us.m247.com (45.87.214.193)  163.392 ms  114.015 ms  296.273 ms

 3  217.138.223.222 (217.138.223.222)  100.249 ms

    217.138.223.210 (217.138.223.210)  73.814 ms  87.646 ms

 4  te0-3-1-14.201.nr51.b002802-5.mia01.atlas.cogentco.com (38.140.53.65)  123.359 ms

    te0-2-1-9.nr51.b002802-5.mia01.atlas.cogentco.com (38.104.90.217)  325.528 ms  87.053 ms

 5  be3763.rcr21.b002802-2.mia01.atlas.cogentco.com (154.24.30.129)  80.090 ms  84.957 ms  74.048 ms

 6  be3410.ccr21.mia01.atlas.cogentco.com (154.54.6.85)  77.727 ms  76.056 ms

    be3411.ccr22.mia01.atlas.cogentco.com (154.54.26.41)  107.551 ms

 7  be3570.ccr42.iah01.atlas.cogentco.com (154.54.84.1)  106.891 ms

    be3569.ccr41.iah01.atlas.cogentco.com (154.54.82.241)  110.317 ms

    be3570.ccr42.iah01.atlas.cogentco.com (154.54.84.1)  105.195 ms

 8  be2927.ccr21.elp01.atlas.cogentco.com (154.54.29.222)  129.740 ms

    be2928.ccr21.elp01.atlas.cogentco.com (154.54.30.162)  120.706 ms  139.252 ms

 9  be2930.ccr32.phx01.atlas.cogentco.com (154.54.42.77)  126.139 ms  134.253 ms  125.011 ms

10  be2931.ccr41.lax01.atlas.cogentco.com (154.54.44.86)  141.096 ms  137.965 ms

    be2932.ccr42.lax01.atlas.cogentco.com (154.54.45.162)  137.944 ms

11  be3360.ccr41.lax04.atlas.cogentco.com (154.54.25.150)  142.443 ms  137.632 ms

    be3271.ccr41.lax04.atlas.cogentco.com (154.54.42.102)  139.926 ms

12  38.122.147.122 (38.122.147.122)  139.789 ms  203.835 ms  306.701 ms

13  116.119.68.100 (116.119.68.100)  409.570 ms

    182.79.134.219 (182.79.134.219)  409.480 ms

    116.119.68.100 (116.119.68.100)  525.812 ms

14  125.17.159.10 (125.17.159.10)  407.898 ms  410.622 ms  1126.678 ms

15  but.core-bhr.core.ntc.net.np (202.70.93.73)  920.725 ms  571.759 ms  715.819 ms

16  ptn.core-but.core.ntc.net.np (202.70.93.110)  511.481 ms  612.101 ms  386.669 ms

17  ptn.acc-ptn.core.ntc.net.np (202.70.93.95)  409.220 ms  405.307 ms  472.254 ms

18  ptn.acc-ptn.ne.acc.ntc.net.np (202.70.93.100)  511.400 ms  990.081 ms  771.333 ms

19  202.70.79.1 (202.70.79.1)  541.801 ms  378.448 ms  396.731 ms

20  sumo-147-242.nitc.gov.np (202.45.147.242)  417.438 ms  392.895 ms  370.286 ms

21  144-162.nitc.gov.np (202.45.145.162)  449.133 ms  408.488 ms  409.836 ms

22  sumo-147-252.nitc.gov.np (202.45.147.252)  380.957 ms  374.867 ms  395.175 ms

23  sumo-147-252.nitc.gov.np (202.45.147.252)  378.706 ms  407.475 ms  495.505 ms

24  sumo-147-252.nitc.gov.np (202.45.147.252)  425.910 ms  407.672 ms  424.088 ms
Example: Analyzing traceroute results
There’s a lot of interesting information that we can gather from the traceroute above. Our first hop - 10.28.0.1 - doesn’t tell us too much because it’s just the local gateway for our subnet. But we can start to really dig into the path our packets take on their round-the-world trip with the second result: “vlan156.as06.mia1.us.m247.com”.
When dealing with hostnames it’s sometimes more helpful to start from the right and work your way left. Using that tactic, we can google “m247” to discover that it is a United Kingdom-based service provider with locations around the world. We can also deduce that this particular router is located in the US, and specifically in the Miami, Florida area, by looking at the two components of the hostname immediately to the left of m247.com. Note the three-letter abbreviation “mia”. Although there is no requirement to do so, many companies label the geographic location of routers using the three-letter airport codes from the International Air Transport Association (IATA). The final two portions of the hostname detail the router’s place within the service provider’s network, with the “as06” likely an abbreviation for the autonomous system number and “vlan156” referring to the VLAN that our packets found themselves traveling through.
You might notice that the third line actually lists two different IP addresses. Remember that by default, the traceroute will send three packets to each hop. There’s no guarantee that each packet will be routed in exactly the same way. In this example, the second and third packets ended up taking a slightly different path. This could be due to load balancing, temporary network congestion, or a number of other factors.
By the fourth line, we can see that our packet is still in Miami, but the end of the hostname shows that it’s now moving through the network of Cogent Communications instead of m247. Cogent is a large ISP with a global network. Lines 4 through 11 illustrate the path through various cities in the US - remember those IATA codes - before ending up at a Cogent node in Los Angeles.
Something interesting happens between line 12 and 13. We can see that the round trip times begin to greatly increase at this point. There are no hostnames, but a variety of sites and “whois” databases can help gather information about IP addresses in their absence. Using this technique, I was able to discover that all three of the IP addresses on line 13 (remember that routing decision are made on a per-packet basis) are assigned to Bharti Airtel, a telecom service provider in India. That means that in-between lines 12 and 13, our packets are traveling from the west coast of the United States to India, likely through one of the many undersea cables that now criss-cross the Pacific Ocean.
By line 15, we can see that our traceroute packets are hitting the network of Nepal Telecom based on the “ntc.net.np” hostname, and finally at 24 to the server hosting the official website for the Nepalese government. It’s worth pointing out that while the round-trip times are higher than they would be for a closer target, our data is still traveling halfway around the world in less than half a second. Hopefully, our little trip helped you understand how to read a traceroute!
Traceroute FAQ
What is the difference between ping and traceroute?
Ping and traceroute are both network diagnostic tools, but traceroute is a little more complex. Ping will test connectivity between two hosts but gives no information on the path between those two hosts. The traceroute tool, on the other hand, displays all of the intermediate hops between source and destination. This can be useful during intermittent connectivity episodes, for example, if only 50% of the pings between two points are successful.
Are tracert and traceroute the same?
Tracert and traceroute perform virtually identical functions, but the underlying code between the two tools is different. Tracert was created by Microsoft for Windows operating systems, while the earlier traceroute is for Unix-based systems. There are slight differences in the default parameters between the two tools, such as the type of packets used.
What about MTR, Tracepath, Paris Traceroute, etc.?
The original traceroute tool, which dates all the way back to 1987, isn’t always able to produce accurate results. Load Balancing, Network Address Translation (NAT), firewalls, and other factors can result in inaccurate or incomplete results. A number of similar tools, such as mtr, and Paris Traceroute, implement the same basic idea as traceroute but attempt to address the classic tool’s shortcomings through various means. Some tools also sought to build on the output and streamline configuration vs the original.
I want to trace an IPv6 route! What can I do?
You’re in luck! The traceroute6 and tracert6 commands provide the same functionality as traceroute but for IPv6 networks. Many of the similar tools (see above) also have support for IPv6.
What specific problems can traceroute help diagnose?
Traceroute is primarily a diagnostic tool used to identify network connectivity issues and performance bottlenecks. It can reveal where data packets are dropped or excessively delayed, helping pinpoint root causes of sporadic connectivity or slow network performance. System administrators and network engineers use it to visualize traffic flow and identify irregular or suboptimal paths within an organization or across the internet.
How does traceroute precisely leverage Time-to-Live (TTL) values?
Traceroute manipulates the Time-to-Live (TTL) field in IP packet headers to map network paths. It sends packets with a TTL value of one, triggering the first router to return a "Time to live exceeded" message. This process repeats, incrementing the TTL by one for each subsequent probe, allowing traceroute to gather information from each router (hop) along the path until the destination is reached.
What insights can be gained from analyzing IP addresses and hostnames in traceroute results?
Analyzing IP addresses and hostnames in traceroute output can reveal the specific routers and networks a packet traverses. Hostnames often include geographic indicators or service provider details, helping to map the physical path and identify the Autonomous Systems involved. Unresolved IP addresses may require external WHOIS lookups to determine their origin or ownership, offering deeper insights into the global route data takes.
What do asterisks or timeouts in traceroute results indicate?
An asterisk in traceroute results signifies that no response was received from a router at a particular hop. This can happen if organizations block or filter ICMP packets used by traceroute, often for security reasons or to deprioritize diagnostic traffic. Multiple consecutive timeouts might suggest a firewall blocking the path, a connection problem, or an unreachable router, impeding the full trace.

Conclusion
You now understand a little bit more about how traceroute works. It may not be as exciting a topic as password spraying or zero-day vulnerabilities, but it can still be a fun tool. But while you’re tracing those Netflix streams and cat memes, don’t forget to think about security! The Varonis Data Security Platform is a great place to start!
Related content


-1.png)