Stack memory is a section in memory used by functions to store data such as local variables and parameters that will be used by the malware to perform its nefarious activity on a compromised device.
Discover your weak points and strengthen your resilience: Run a Free Ransomware Readiness Test
- What is Stack Memory?
- Stack Memory Architecture
- Stack Memory Classroom Example
- Practical Example: Stack Memory and x64dbg
This is a subject which I will compare to subnetting, it takes a bit of work and you may perhaps need to re-read this article more than once before it clicks. This is a subject I certainly struggled with at first but it will click and make you a better malware analyst for having this knowledge. With that in mind let’s get started!
This post is the third in a four-part series regarding the malware analysis tool, x64dbg:
- Part 1: What is x64dbg + How to Use It
- Part 2: How to Unpack Malware With x64dbg
- Part 3: Stack Memory: An Overview
- Part 4: x64dbg Tutorial
What is Stack Memory?
Stack memory is often referred to as LIFO (last in, first out). Think of this as a bunch of building bricks stacked on top of one another, you can’t take from the middle as the stack will fall so the last brick placed on top has to first be removed. This is how the stack works.
In a previous article, I explained what the registers are in x64dbg and also some basic assembly instructions. This information is needed to understand how the stack operates. When new data is added to the stack, the malware will use the ‘PUSH’ command. To remove an item off the stack, the malware will use the ‘POP’ command. Data can also be popped off the stack and into a register.
The register ‘ESP’ is used to point to the next item on the stack and is referred to as the ‘stack pointer’.
EBP aka the ‘frame pointer’ serves as an unchanging reference point for data on the stack. This allows the program to work out how far away something in the stack is from this point. So if a variable is two ‘building blocks’ away then it is [EBP+8] as each ‘block’ in the stack is 4 bytes.
Each function in a program will generate its own stack frame to reference its own variables and parameters using this technique.
Stack Memory Architecture
The following diagram should help illustrate how the stack is laid out like a set of building blocks:

Lower memory addresses are on top and higher memory addresses are on the bottom.
Each function will generate its own stack frame, so the stack frame in the example above could be on top of another frame on the stack which is being used for another function.
EBP as mentioned earlier is stored as an unchanging reference point on the stack, this is done by moving the value of ESP (the stack pointer) into EBP. We do this as ESP will change as it always points to the top of the stack, storing it in EBP gives us an unchanging reference point in the stack and now the function can reference its variables and parameters on the stack from this location.
In this example parameters that have been passed to the function are stored in ‘[EBP]+8’, ‘[EBP]+12’ and ‘[EBP] +16’. So when we see ‘[EBP]+8’ that is the distance on the stack from EBP.
Variables will be stored after the function has begun executing so these will be stored higher up the stack but in lower address space, so in this example, this will be shown as ‘[EBP]-4’.
Stack Memory Classroom Example
To help illustrate this I have an example of a simple C program that calls a function called ‘addFunc’ which adds two numbers together (1+4) and prints the output to the screen.
- #include "stdio.h"
- int addFunc (int a, int b);
- int main (void) {
- int x = addFunc(1,4);
- printf("%d\n", x);
- return 0;
- }
- int addFunc(int a, int b) {
- int c = a + b;
- return c;
Focusing on the ‘addFunc’ function code, there are two parameters (a and b) passed as arguments and a local variable of ‘c’ which is where the result is stored. Once the program is compiled it could then be loaded into x64dbg. Below is what the assembly code would look like for this program:
- push ebp
- mov ebp,esp
- sub esp,10
- mov edx,dword ptr ss:[ebp+8]
- mov eax,dword ptr ss:[ebp+C]
- add eax,edx
- mov dword ptr ss:[ebp-4],eax
- mov eax,dword ptr ss:[ebp-4]
- leave
- ret
The first three lines are what’s known as the function prologue, this is where space is created on the stack for the function.

push ebp preserves ESP, the previous stack frame pointer, this is so it can be returned to at the end of the function. A stack frame is used to store local variables and each function will have its own stack frame in memory.
mov ebp, esp moves the current stack position into EBP which is the base of the stack. We now have a reference point that allows us to reference our local variables stored on the stack. The value of EBP now never changes.
sub esp, 10 grows the stack by 16 bytes (10 in hex) to allocate space on the stack for any variables we need to reference.
Below is what the stack would look like for this program. Each piece of data that is being used is stacked on top of each other in a section of memory as per the diagram provided earlier.
EBP-10
EBP-C
EBP-8
EBP-4 (int c)
EBP = Pushed to the stack at the start of the function. This is the start of our stack frame.
EBP+4 = Return address of previous function
EBP+8 = Parameter 1 (int a)
EBP+C = Parameter 2 (int b)
In this example we can see by looking at the stack we have been allocated space for four local variables, however, we only have one variable which is ‘int c’.
mov edx,dword ptr ss:[ebp+8] – Here we are moving ‘int a’, which is the value 1, into the EDX register.
The important part here is [ebp+8]. It’s in square brackets which means you are directly addressing the memory at this location. This is referencing the location in memory that is 8 bytes higher up the stack than what is in EBP.
I mentioned earlier the parameters that are passed to a function will always be in higher address space which is lower down the stack. Our parameters ‘int a’ and ‘int b’ were passed to the function before the stack frame was created so this is why they reside in ‘ebp+8’ and ‘ebp+c’.
mov eax,dword ptr ss:[ebp+C] – Same as above, although we’re now referencing ‘ebp+C’ which is ‘int b’, the value ‘4’, and moving it into the EAX register.
add eax, edx – This performs the addition and stores the result in ‘EAX’.
mov dword ptr ss:[ebp-4],eax – Here we’re moving the result stored in ‘EAX’ into the local variable ‘int c’.
The local variable ‘c’ is defined within the function, therefore it’s in a lower memory address than the top of the stack. Therefore because it’s inside the stack frame, and is of size 4 bytes, we can just use some of the space we allocated for the variables earlier by subtracting 10 from esp, and in this case use ‘EBP-4’.
mov eax,dword ptr ss:[ebp-4] – Most functions return with the value stored in ‘EAX’, so where above the return value is in ‘EAX’ and we moved it to the variable ‘c’, here it’s just putting it back again into ‘EAX’ ready to return.
Leave – This is a mask for an operation that moves ‘EBP’ back into ‘ESP’ and pops it off the stack, i.e. prepping the stack frame of the function that called this function.
ret – This jumps to the return address to go back to the callee function which has a nicely preserved stack frame because we remembered it at the start of this function.
Practical Example: Stack Memory And x64dbg
In the previous article, I demonstrated how to unpack malware using x64dbg. We can now take a look at some of the functions used by the malware and how the stack is used.
First open the unpacked malware in x64dbg, in this example my malware is simply named ‘267_unpacked.bin’
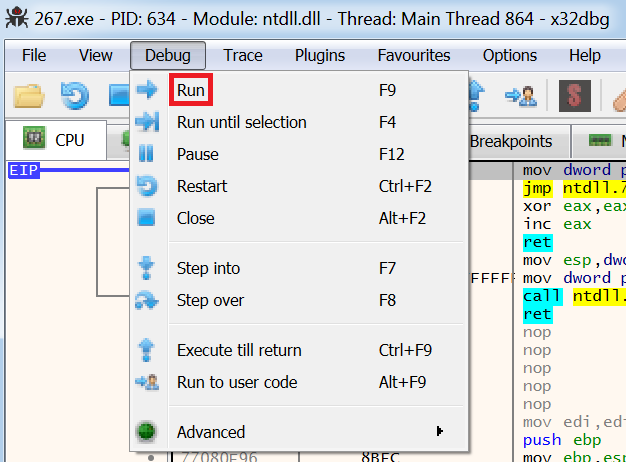
Navigate to the entry point of the malware by selecting ‘Debug’ and then ‘Run’.
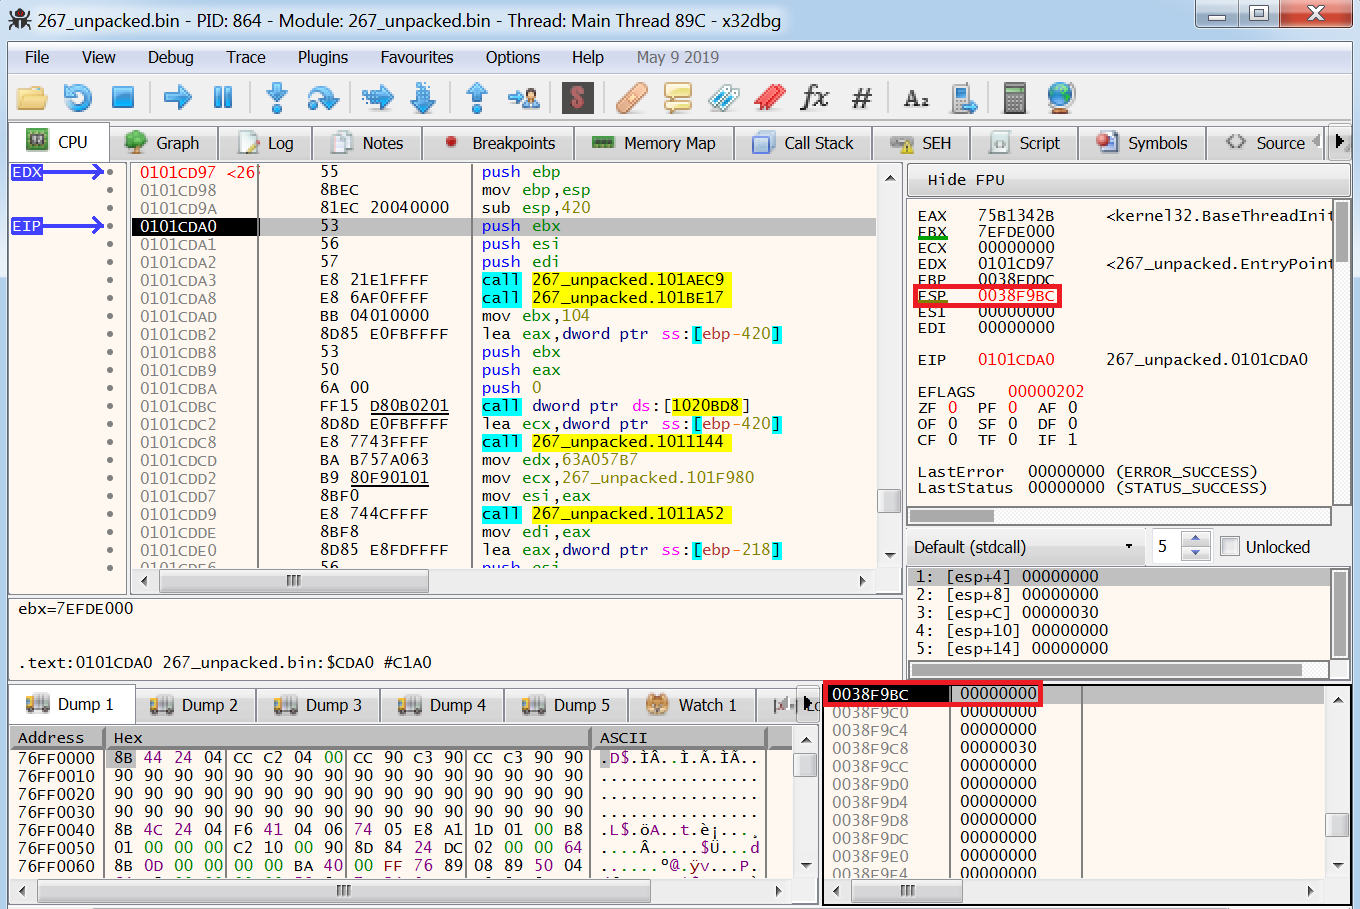
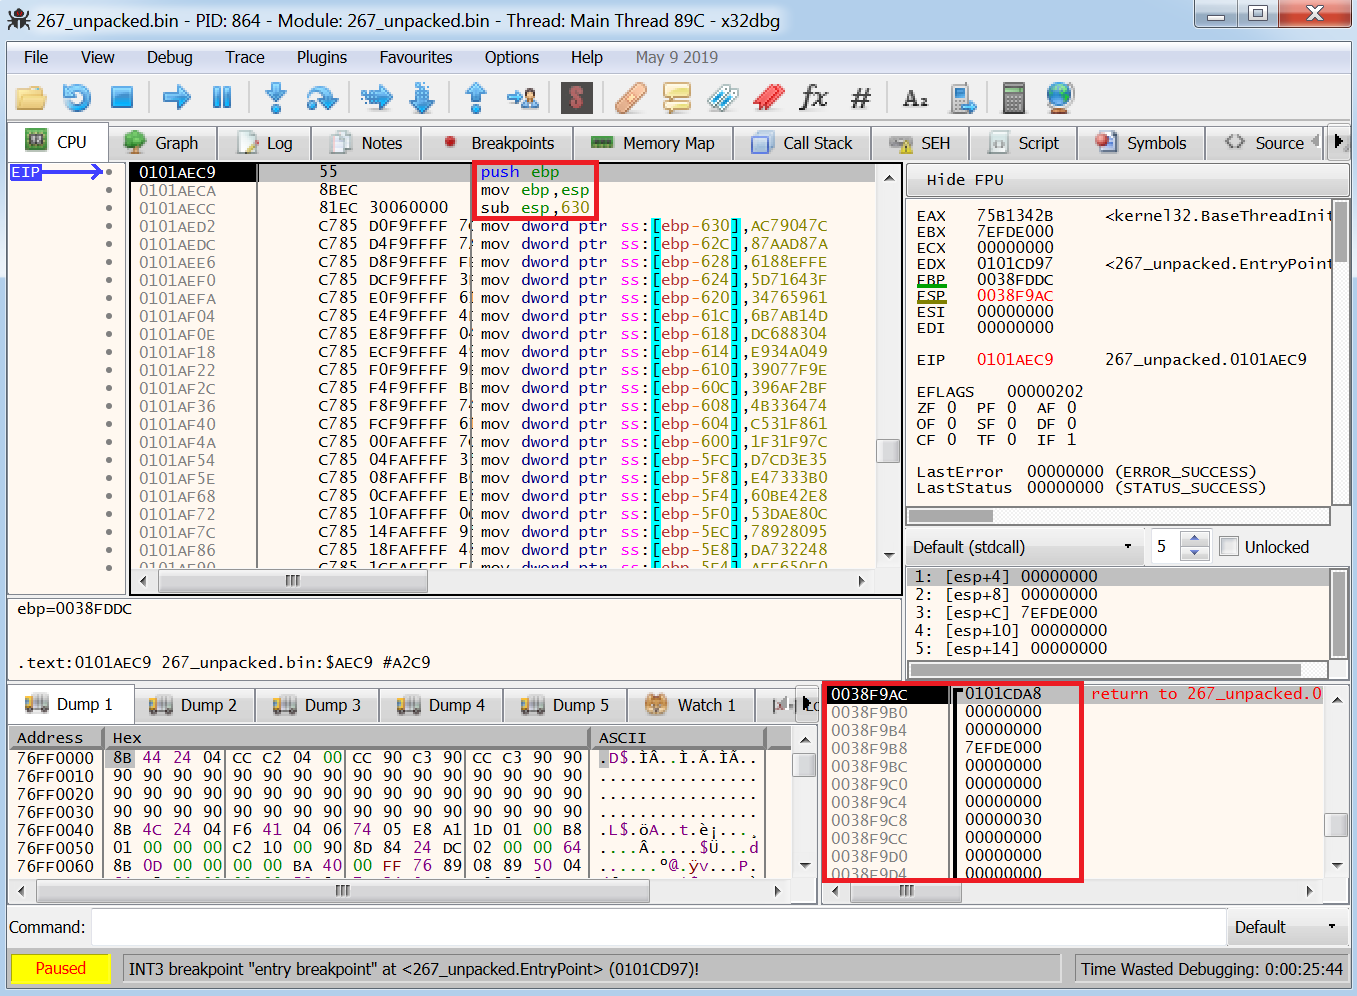
We are now at the entry point of the malware and I have highlighted two windows that contain the stack memory information:
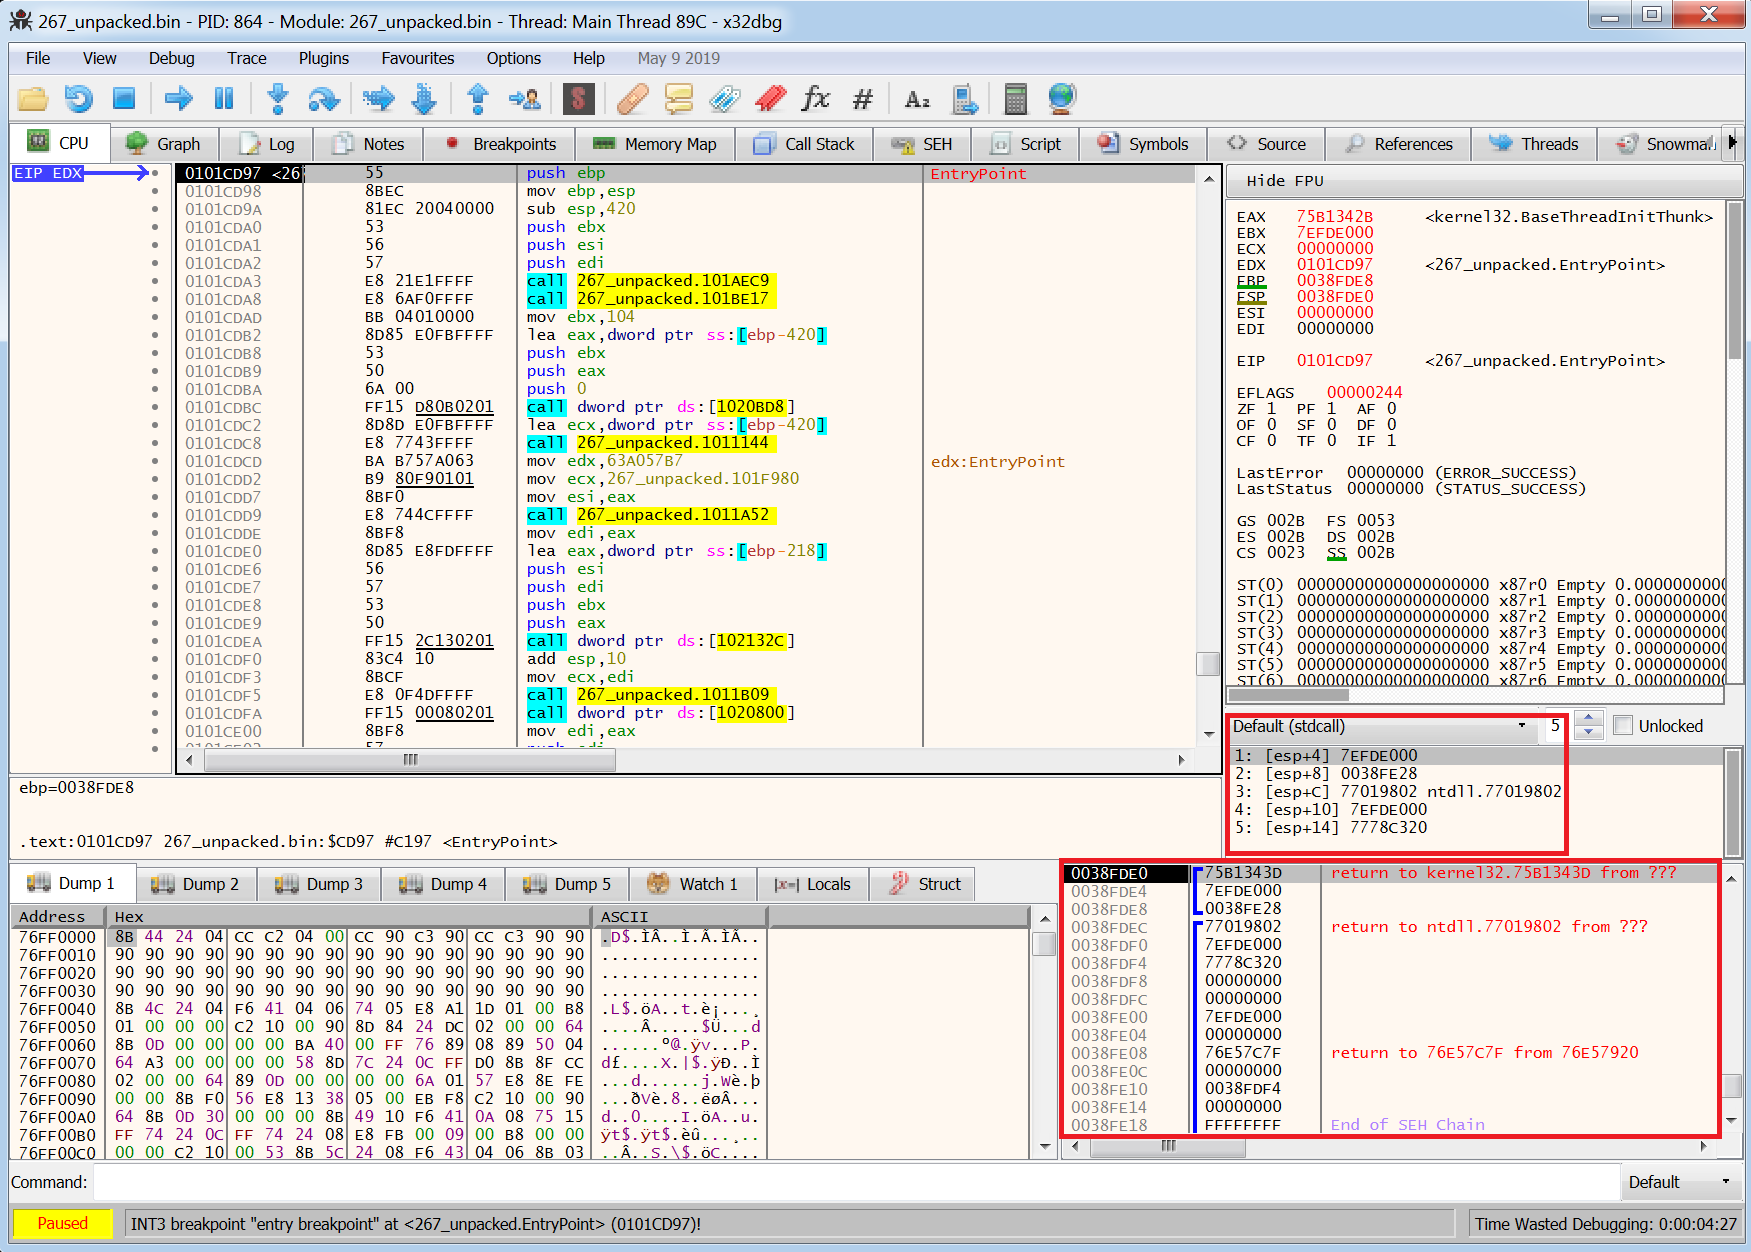
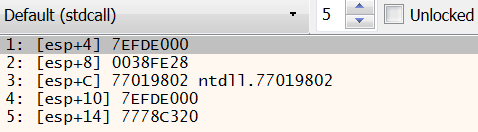
The first window shows parameters that have been pushed onto the stack. We know these are parameters and not variables as they are ‘esp+’ rather than ‘esp-’ as explained earlier.
The second window is the actual stack memory.
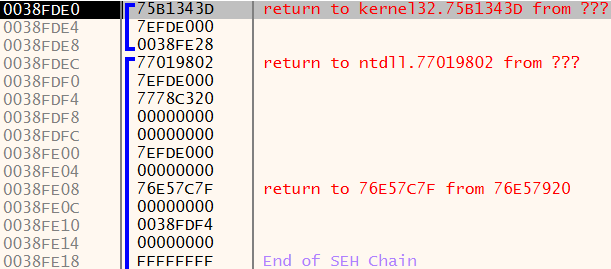
The first column is the list of addresses in stack memory. As mentioned earlier, the higher addresses are at the bottom and the lower addresses are at the top.
The second column contains the data that has been pushed onto the stack and the blue brackets represent individual stack frames. Remember each function will have its own stack frame to store its own parameters.
The third column contains information that it is automatically populated by x64dbg, in this example we can see addresses where x64dbg will return to once a function has been executed.
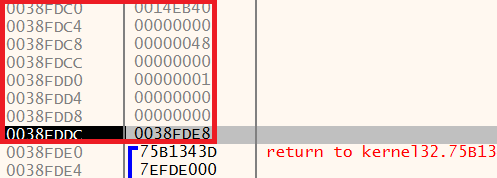
In the image below the first command where ‘EIP’ is pointing is ‘push ebp’, the current value in ‘EBP’ which I have highlighted in the image below is ‘0038FDE8’’
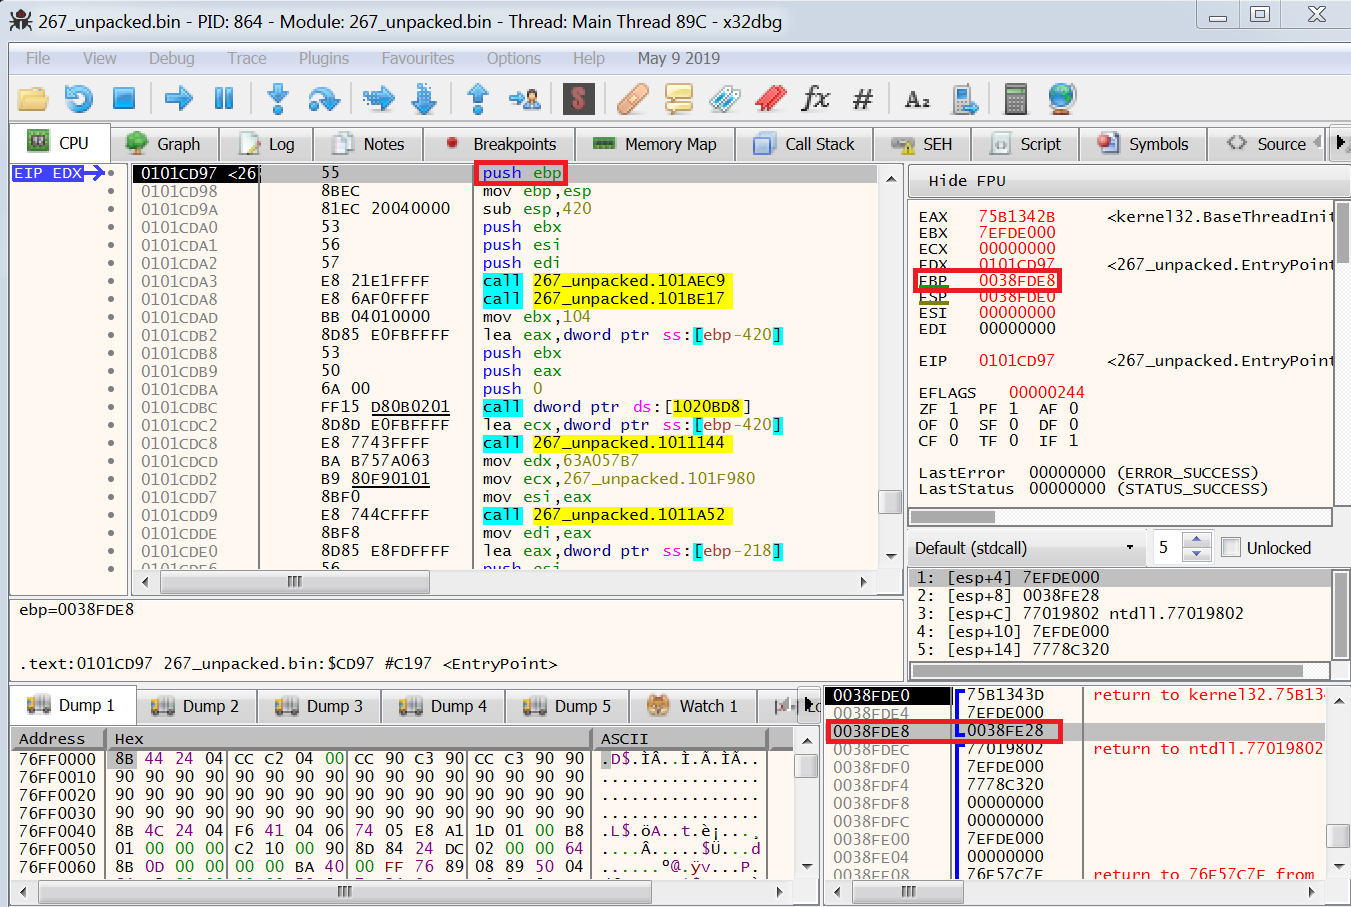
Looking at the stack window I have highlighted this address which is the current base pointer of the stack frame.
By pressing ‘Step over’ ‘EBP’ is then pushed onto the stack so when this function is completed the malware can return to that address.
We now need to move our current stack pointer into ‘ESP’, this is the address ‘0038FDDC’ highlighted below.
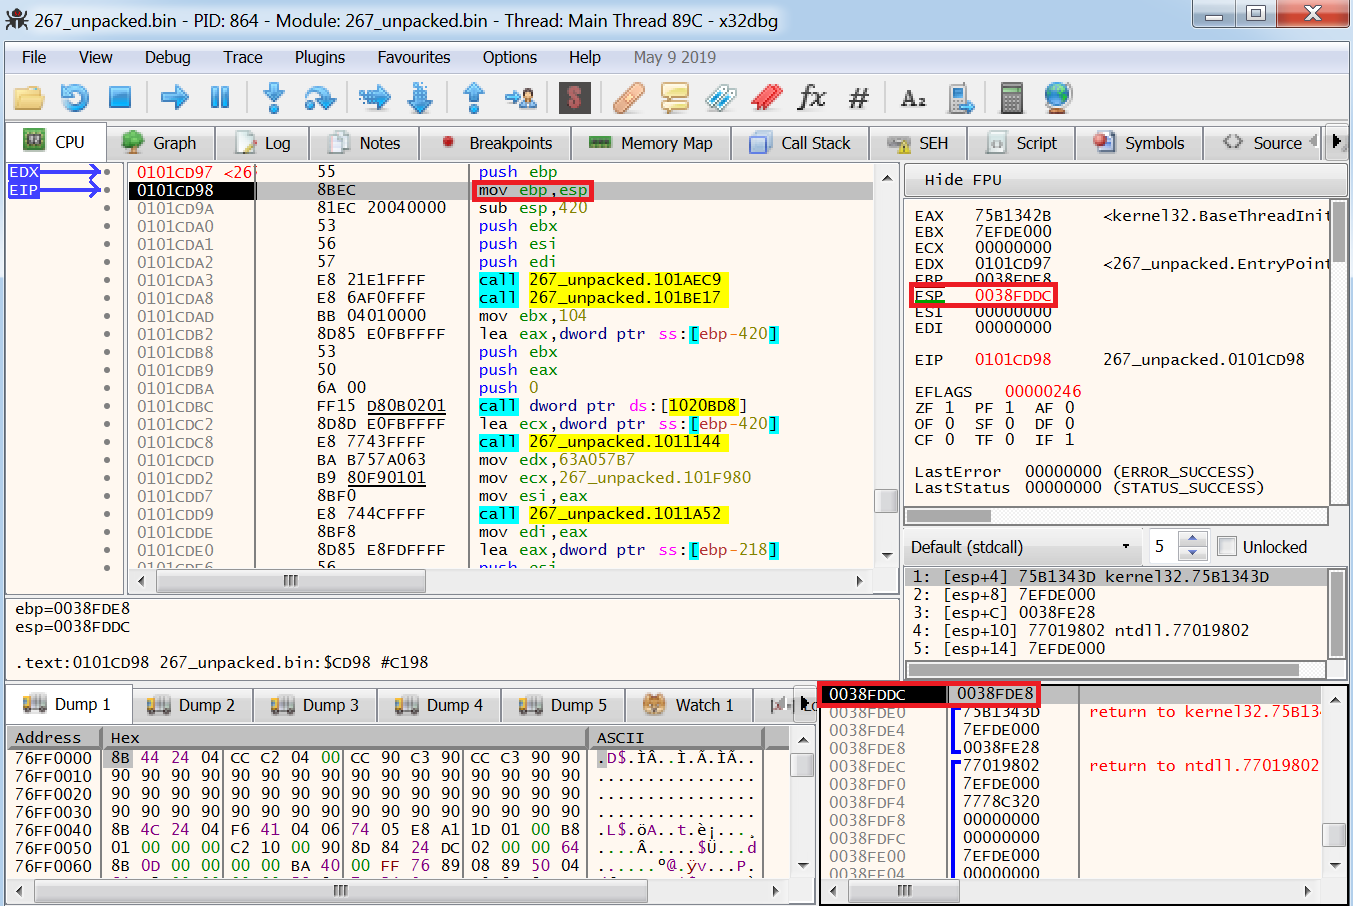
Executing this command moves ‘ESP’ into the ‘EBP’ register which is highlighted below.
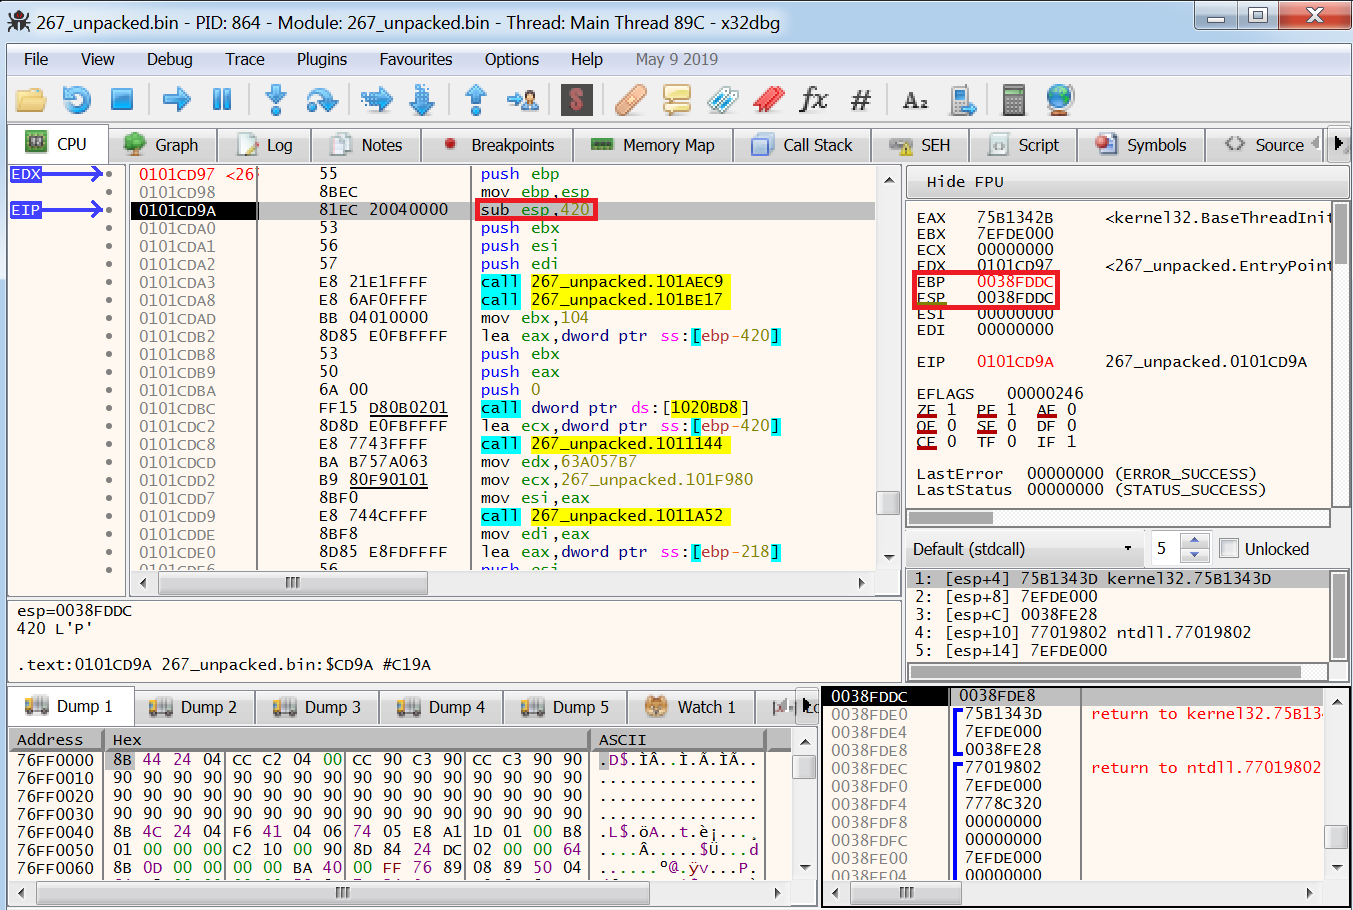
Next, the malware needs to create space on the stack, this is done by subtracting ‘420’ from ESP. It uses subtraction as space will be created in the lower address space which is higher up the stack, the image below shows the lower address space above the current stack frame.
Executing the command ‘ sub esp, 420’ then updates the stack.
Note that we are now in a lower address space which is higher up the stack and ‘ESP’ has now been updated to show the new location at the top of the stack.
This is a common pattern you will see at the start of functions in malware and will become familiar with.
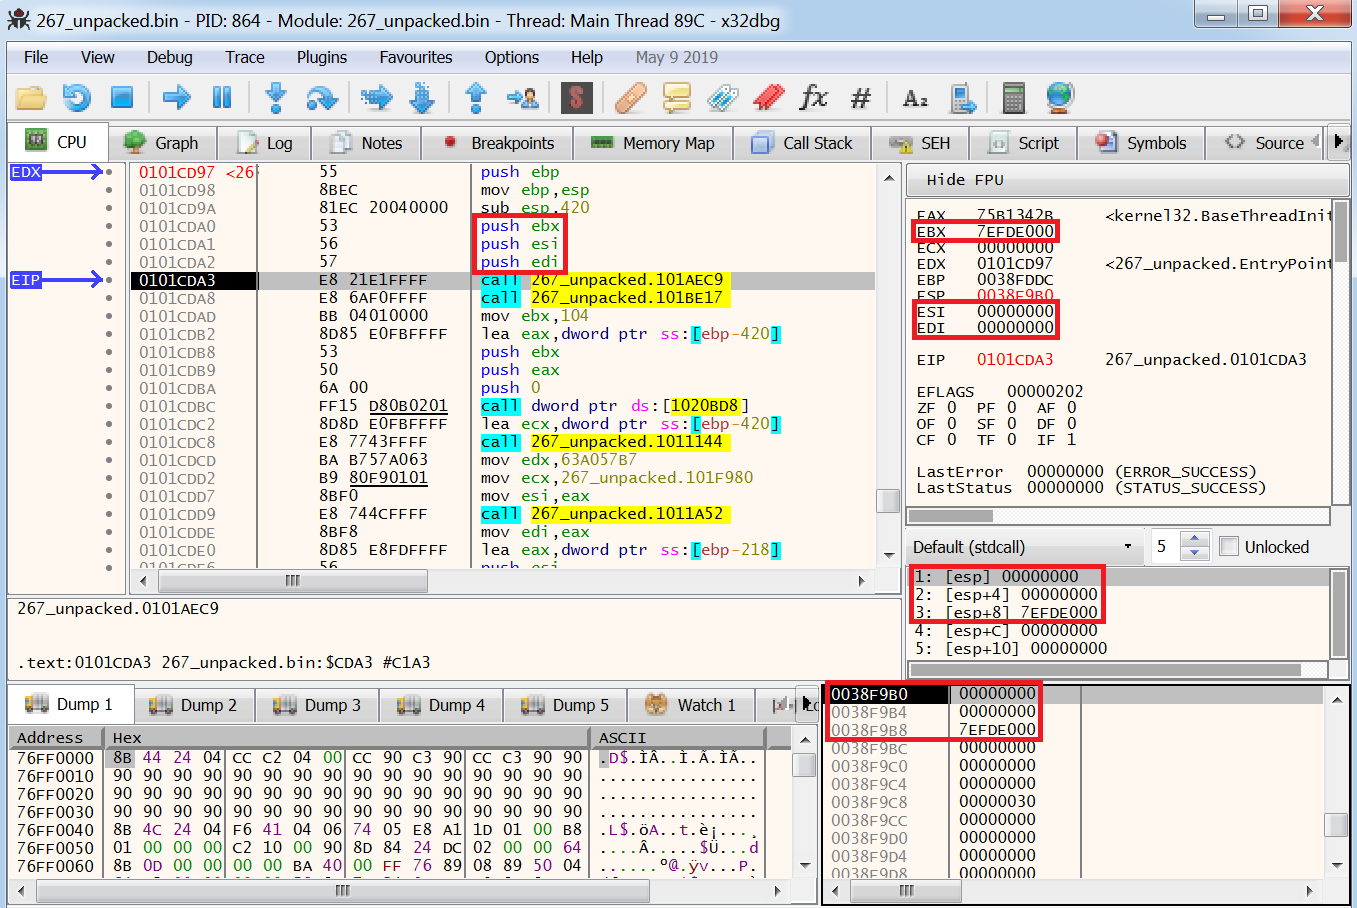
Next, there are three push instructions which are pushing the values of three registers onto the stack, stepping over these instructions updates the stack as we would expect and also updates the parameters window:
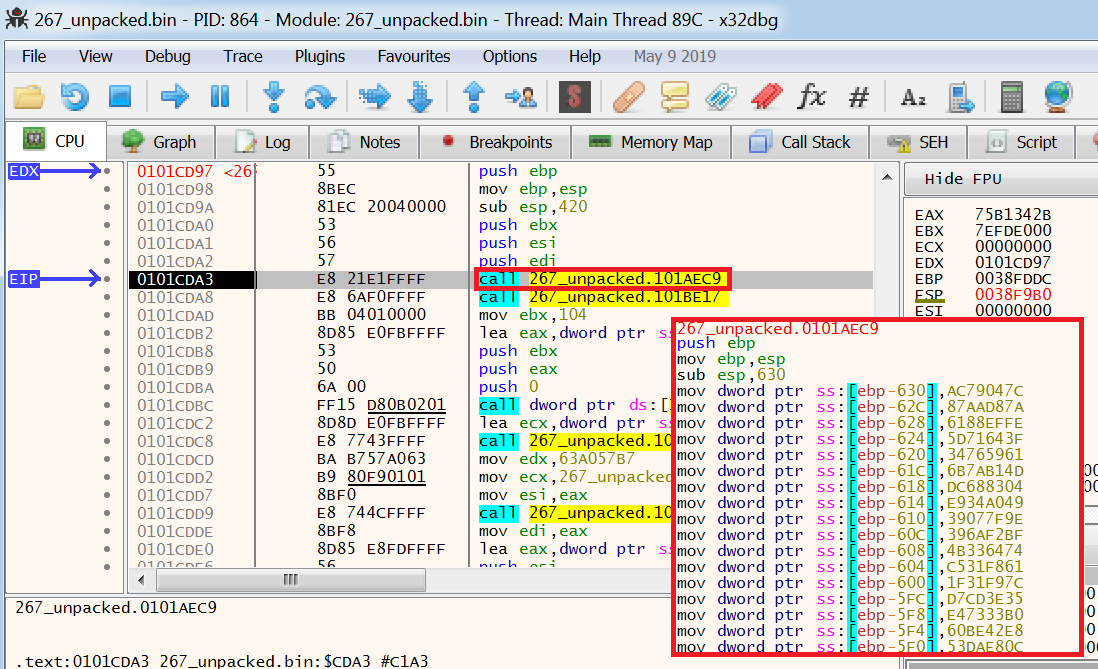
Next, there are a couple of functions that have been written by the malware author, let take a quick look at one of these to see what the function does and how the stack comes into play.
In the image below my mouse is hovering over the function ‘267_unpacked.101AEC9’, by doing this in x64dbg it has generated a popup which is a preview of this function. This allows the user to see some of the assembly code of the function that is being called. In this popup we can see we have a large number of strings being moved into variables, again we know these are variables due to the syntax ‘ebp-’. These strings are obfuscated Windows API calls which will be used by the malware to perform various actions such as create processes and files on disk.
By stepping into this function we can take a closer look at what is going on and also see how the stack comes into play in x64dbg.
A new stack frame is created which I have highlighted in the bottom right and again, as expected, we have the function prologue.
Stepping into this function now updates ‘ESP’ which is the address ‘0038F9AC’ in stack memory which contains the return address to the ‘main’ function and also creates space on the stack by subtracting 630 from ‘ESP’. The instructions which begin with ‘mov’ are then moving the hashed function names into their own variables.
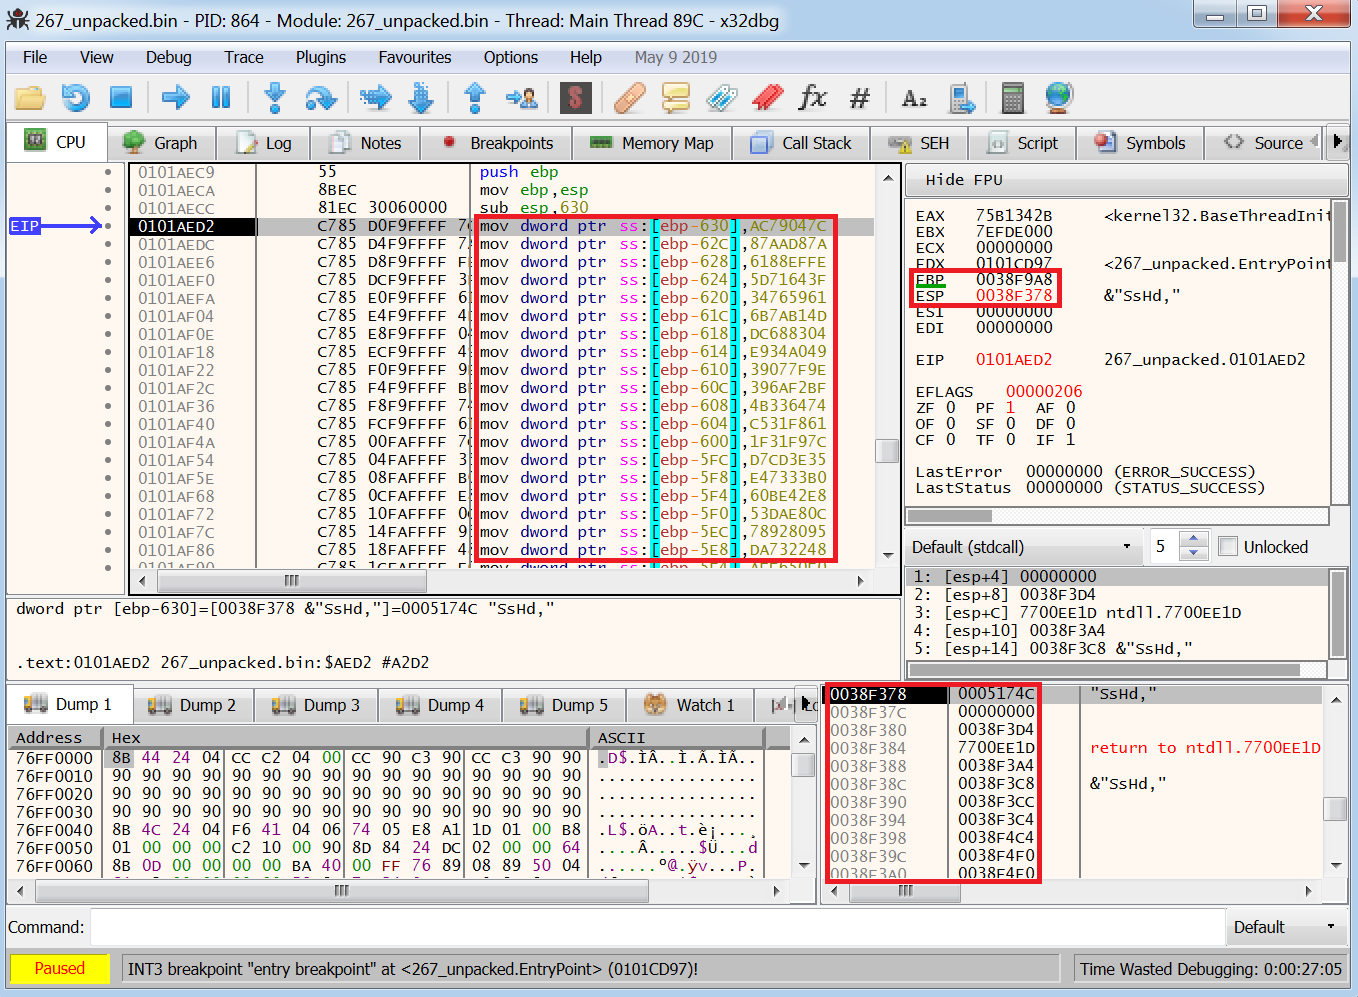
By scrolling down through the assembly code we get to the end of the function and can see a couple of function calls, these are used to deobfuscate the hashes which have just been moved into variables.
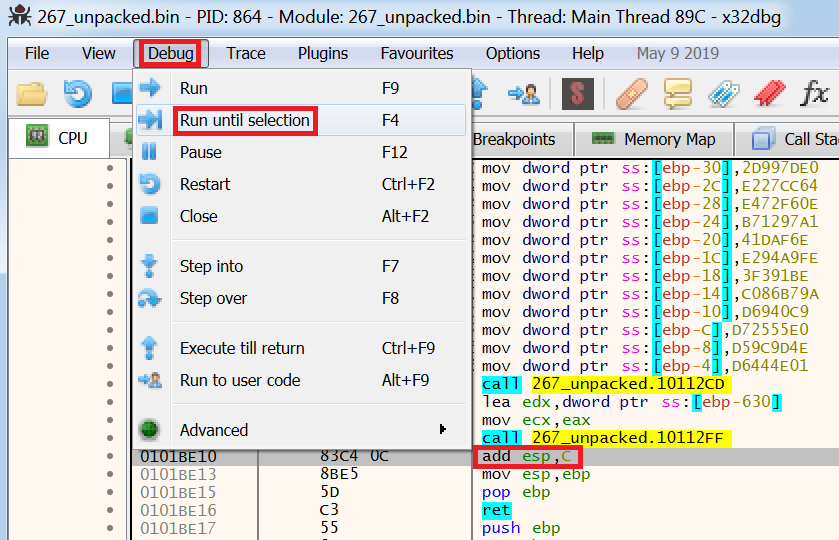
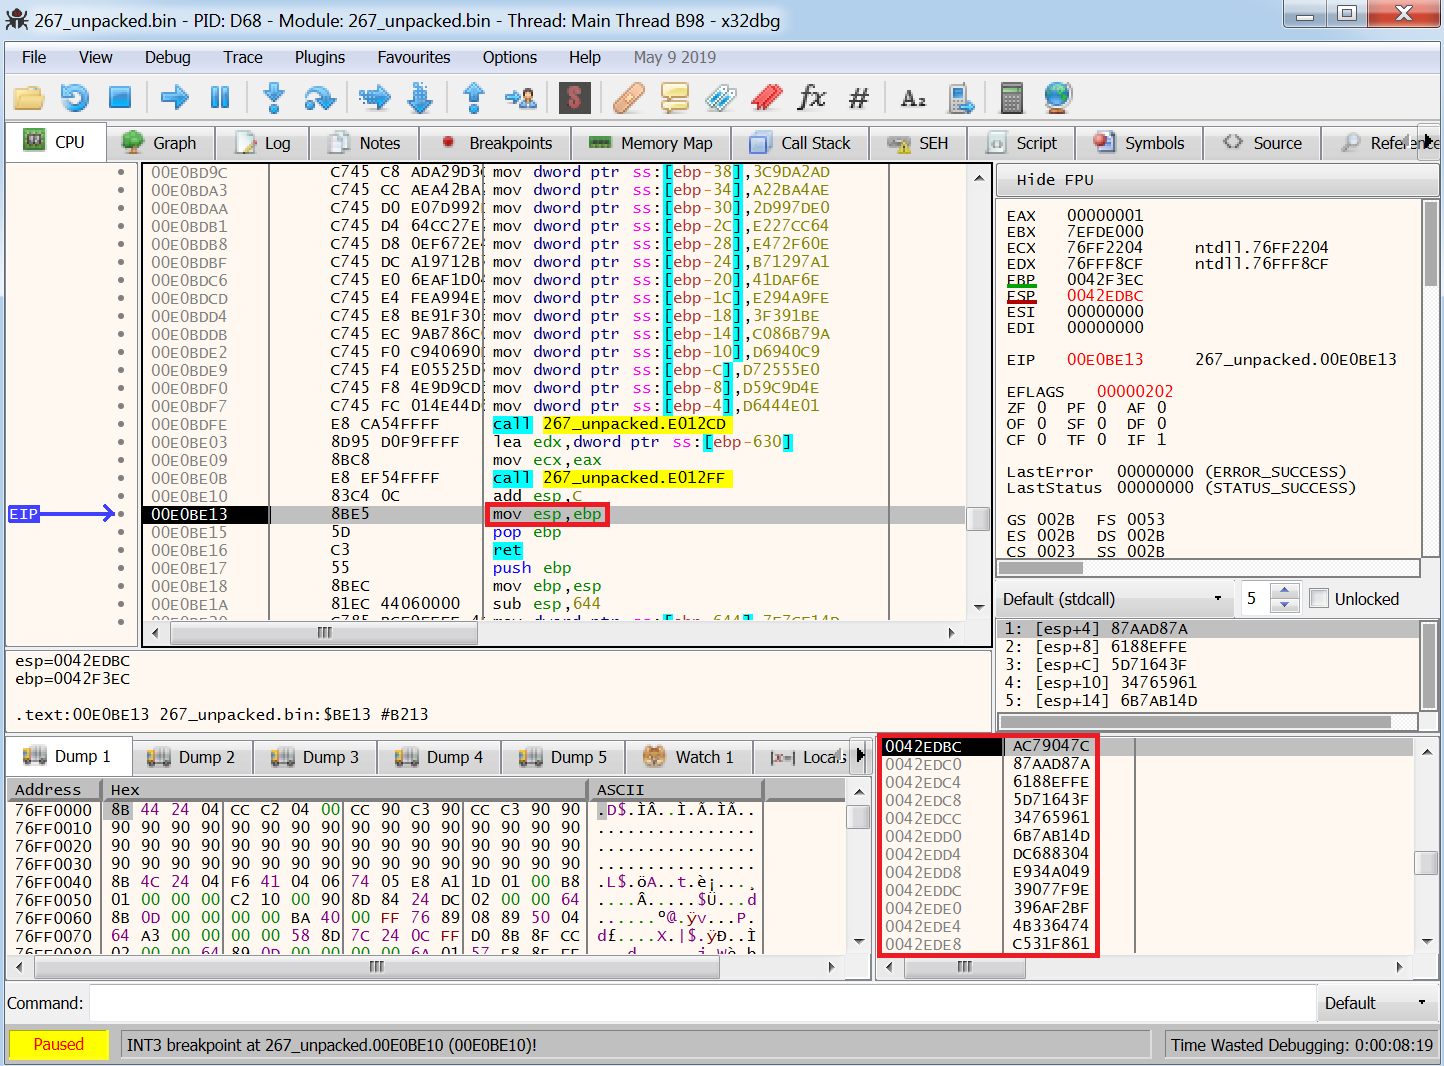
The commands I have highlighted are what’s known as the ‘function epilogue’ which cleans up the stack after the function has been completed. I’m going to navigate to these instructions by selecting the instruction I am interested in, ‘add esp, C’, and selecting ‘Debug’ from the toolbar and ‘Run until selection’.
This updates the ‘EIP’ to the instruction we have highlighted and also shows the stack before being cleaned up.
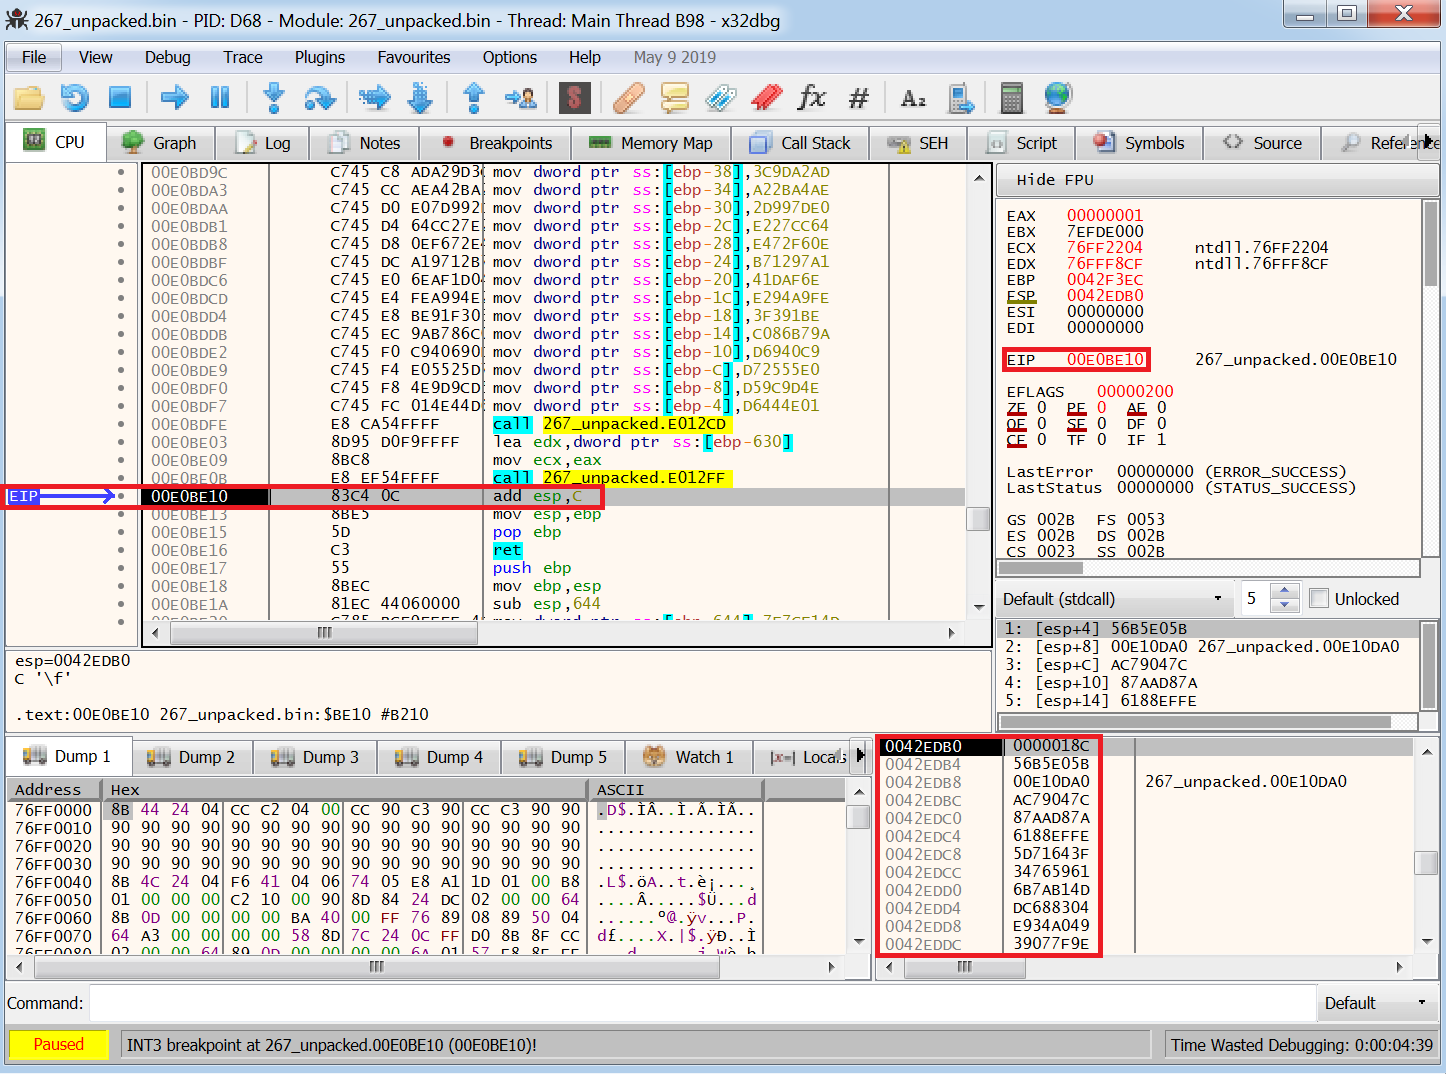
In the function prologue, to create space on the stack the malware had to subtract from ‘ESP’ so it could allocate space on the stack that resided in the lower address space. Now we need to remove the space that was allocated so by executing the command ‘add esp, C’ we are adding the hex value ‘C’ to the stack so that we will move downwards into the higher address space.
The image below shows the updated stack once ‘add esp, C’ has been executed.
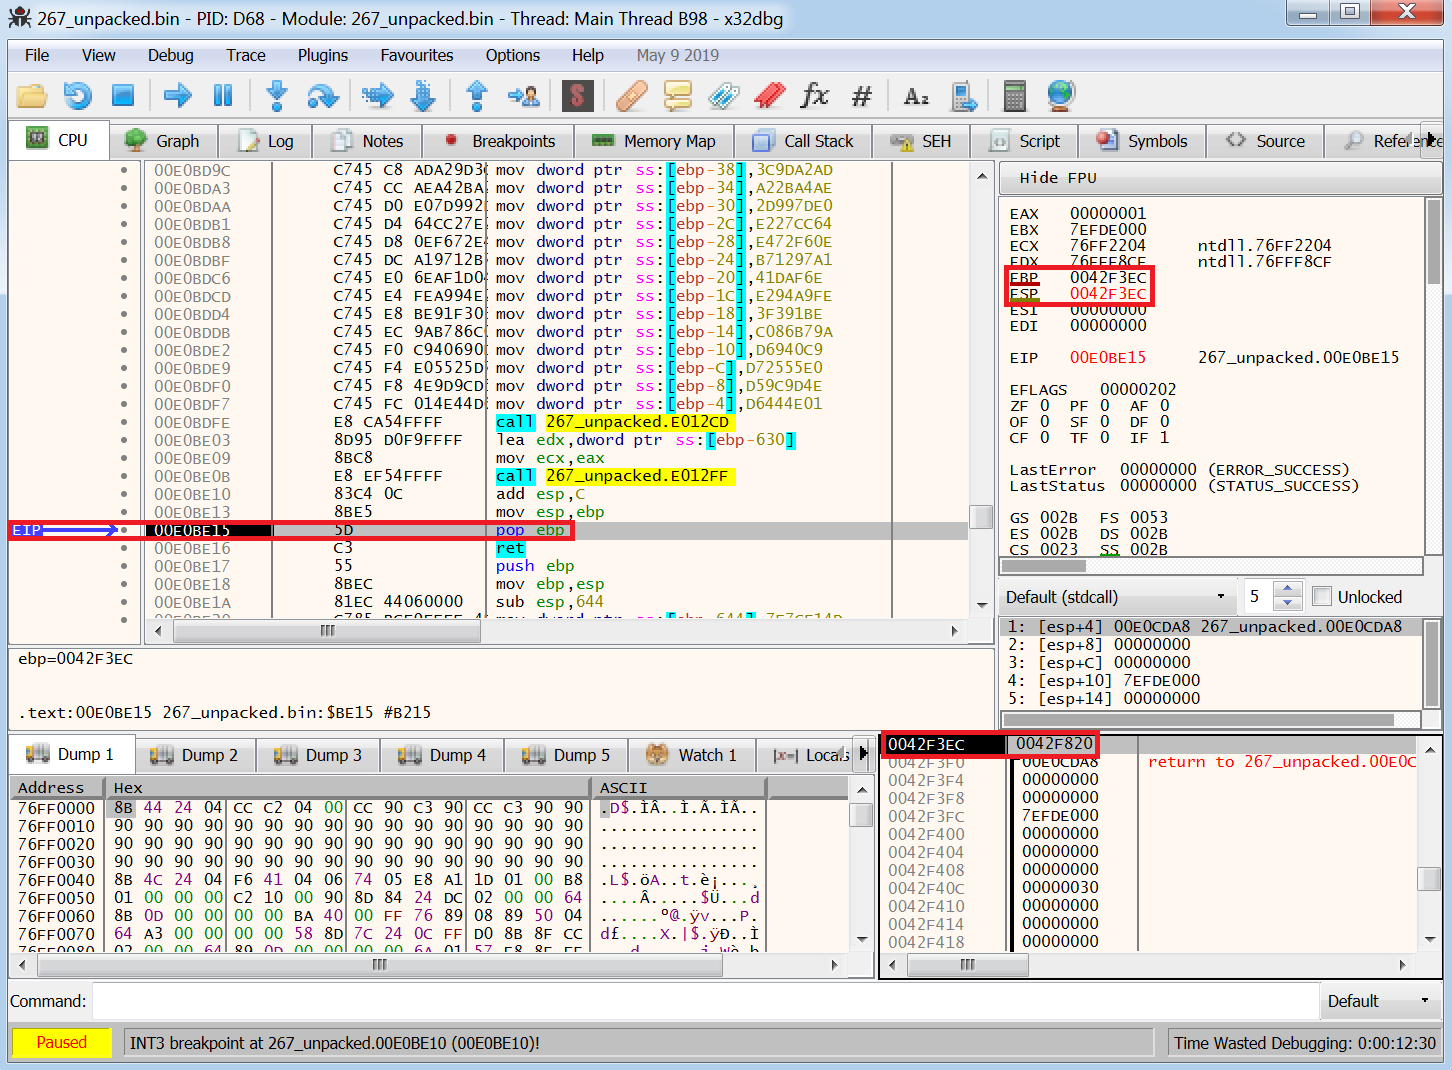
Next is the command ‘mov esp, ebp’ so this is going to move the value in ‘EBP’ to ‘ESP’. Our current ‘EBP’ is ‘0042F3EC’, by scrolling down the data in the stack window we can see that this address contains our old ‘ESP’ which is the stack pointer.
Executing this command now cleans up the stack.
The command ‘pop ebp’ then pops the address ‘00E0CDA8’ which was stored at the top of the stack and moves this into ‘EBP’.
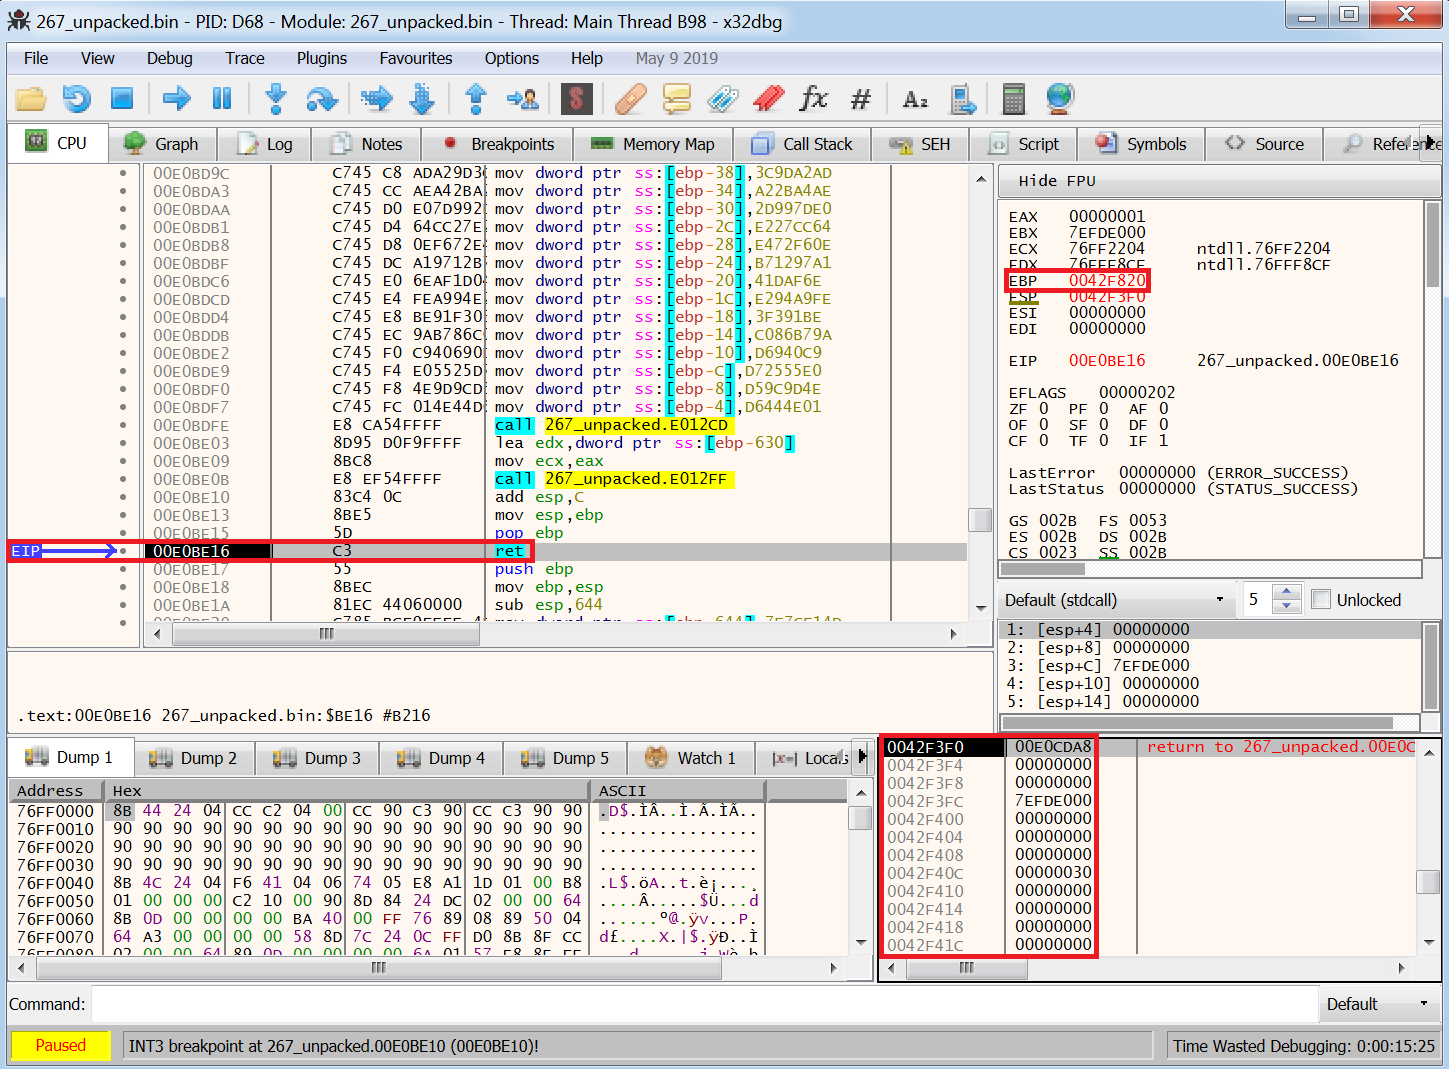
This now means when the next instruction ‘ret’ is executed and we will return to the address ‘00E0CDA8’.
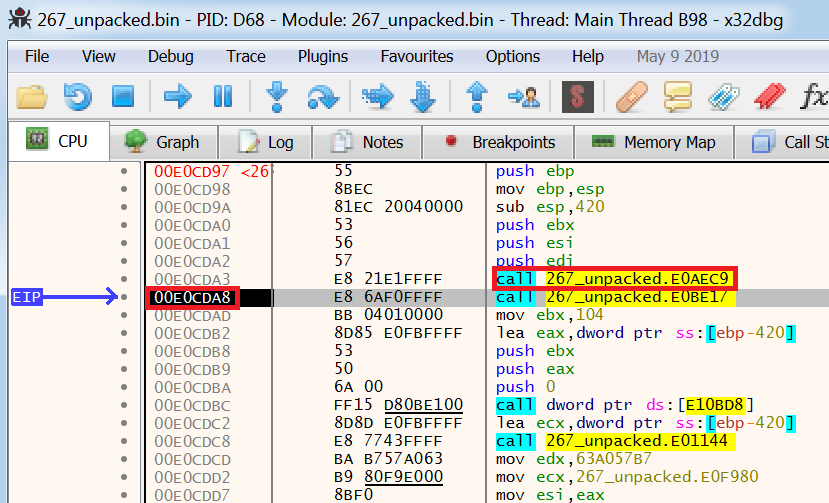
The above image shows we have now returned to the ‘main’ function of the malware and are at the address ‘00E0CDA8’ and are directly after the function we just analyzed in x64dbg.
Now you’re ready to start reverse-engineering malware using x64dbg! In the next article I am going to show how you can apply the knowledge you have gained in these past blog posts to start performing some hands-on reverse engineering.
Finally, to ensure your organization is equipped to detect and respond to threats sign up for a demo of Datalert and also check out best practices you can implement for malware protection.


-1.png)