
This is the fourth and final article in a series of blog posts that serve as an x64dbg tutorial. In this article, we will be taking all the knowledge we have learned so far to demonstrate some techniques that can be used when reverse engineering a piece of malware.
- An overview of x64dbg
- How to unpack malware with x64dbg
- Stack memory and x64dbg
- x64dbg tutorial
x64dbg Use Cases
Reverse engineering malware using a tool such as x64dbg is ideal when you want to understand and research the specific functionality of a malware sample. During a cybersecurity incident, a company’s incident response plan may dictate that a piece of malware needs to be analyzed to identify some key IOC’s.
This can be done by running the malware in a virtual machine and using several malware analysis tools, some key indicators such as C2 IP addresses can be quickly identified along with where the malware is copying itself to on disk to hide.
x64dbg won’t be used for this initial triage of the malware, instead, it would be used to conduct a deeper dive into how the malware operates and behaves on a compromised device. Perhaps running the malware in a VM has shown that it creates a seemingly random name for itself, x64dbg could then be used to identify how the malware generates these filenames.
Step-by-step Malware Analysis Using x64dbg
Using the sample we unpacked in a previous article we can now take a look at some of the functionality within the sample.
Before I load the malware into x64dbg I need to make some changes to where the malware is located on my VM. When analyzing a piece of malware in x64dbg I will often rename the binary and copy it to the location that the malware has done in my behavioral analysis, replicating this behavior gives me added confidence that I will see the true behavior of the malware in my debugger.
When analyzing this sample I found the malware does some checks to avoid being analyzed in tools such as x64dbg, this is done by checking for the presence of a command-line argument that can be identified by detonating the malware and monitoring the activity using ProcMon.

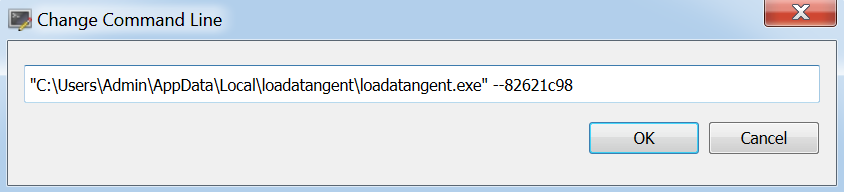
In the above image we can see the malware has renamed itself ‘loadatangent.exe’ and copied itself to the following location:
‘C:\Users\Admin\AppData\Local\loadatangent\loadatangent.exe’
It has also appended the argument ‘–82621c98’ to the process.
To replicate the behavior of the malware I will first rename my unpacked malware to ‘loadatangent.exe’ and move it to this location on disk. I can now begin loading the file into x64dbg by dragging the file onto the x64dbg icon on my desktop.
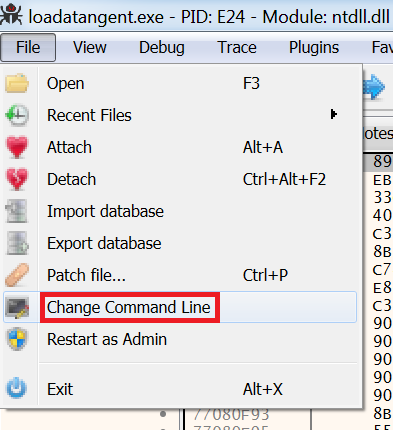
Once x64dbg is loaded I then want to adjust the command line to include the additional argument. This is done by selecting ‘File’ and then the ‘Change Command Line’ option.
From here I can now add the argument that was identified using ProcMon.
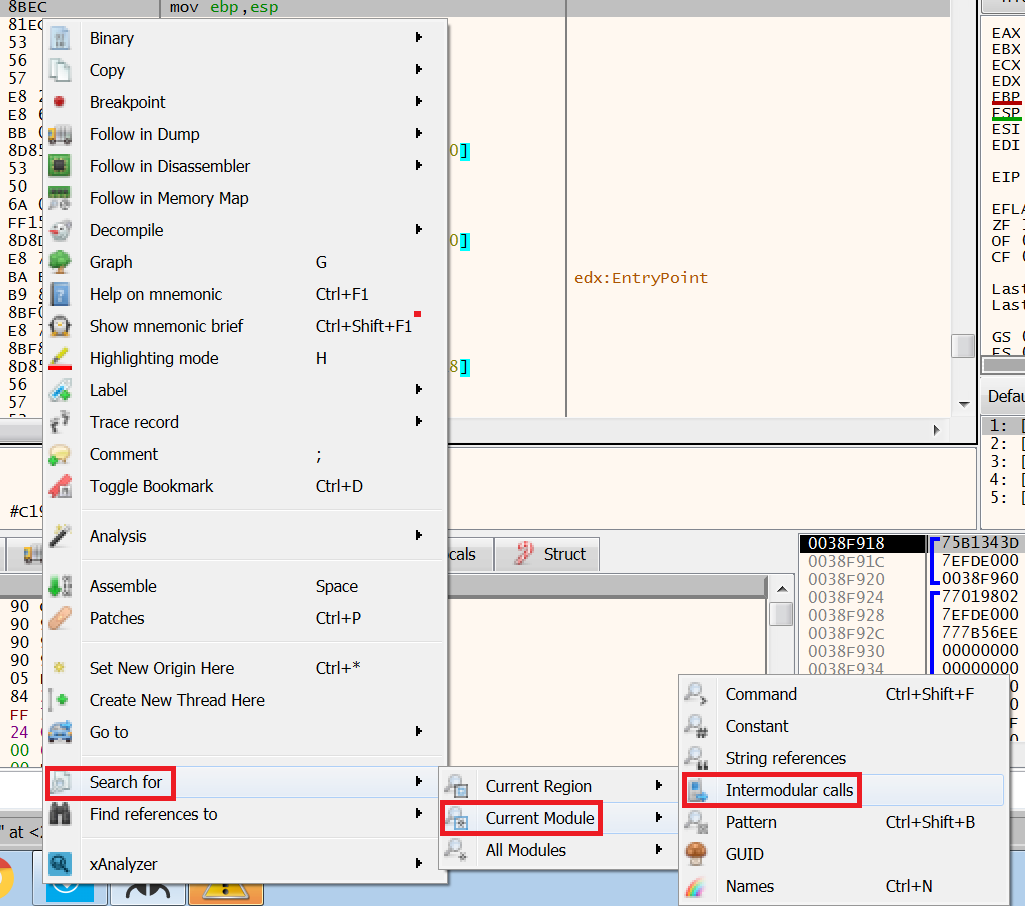
When analyzing an unpacked sample I first check the import address table (IAT) of the malware. This allows me to check for any interesting imported functions that may be areas to focus on in x64dbg.
This is done by right-clicking on the assembly code and selecting ‘Search for’, ‘Current Module’, and then ‘Intermodular calls’.
However, at first this only contains one entry for ‘IsProcessorFeaturePresent’:
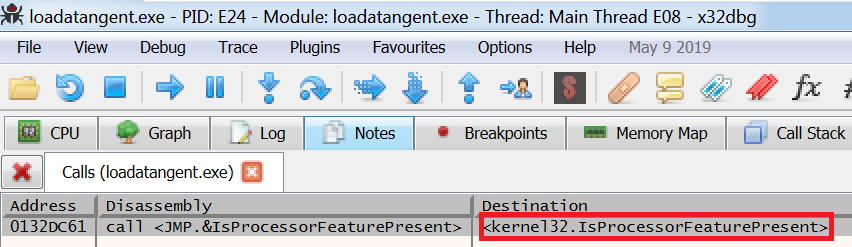
This is because the Windows API names that will be imported by the malware are hashed. This obfuscation of the IAT is a technique used by malware authors in an attempt to complicate any analysis of the binary.
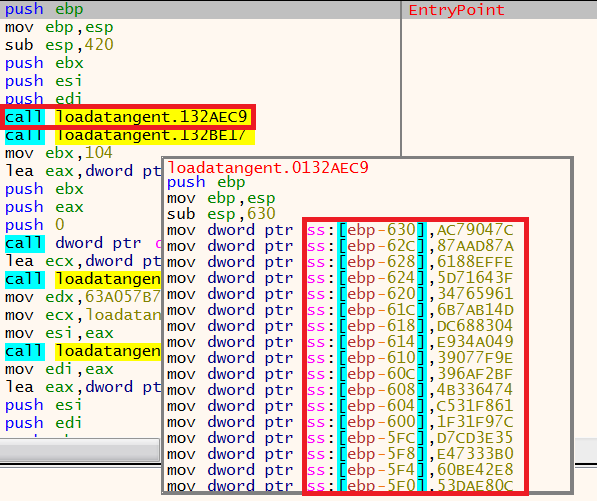
In the above image, I am hovering my mouse over the first function and a popup window is generated which shows a preview of this function. From the article I wrote which covers stack memory we can now identify that the hashed values are being moved into a large number of variables represented by ebp-*.
Due to a large number of variables being declared and the amount of space being allocated on the stack by the instruction ‘sub esp, 630’ it is likely that these values are the obfuscated names of Windows APIs.
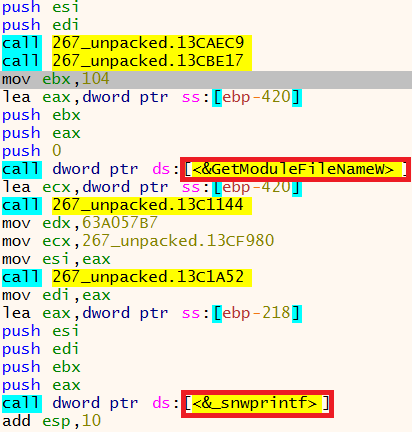
Stepping over these two functions we can now see that some of the function names have changed to legitimate Windows API names.
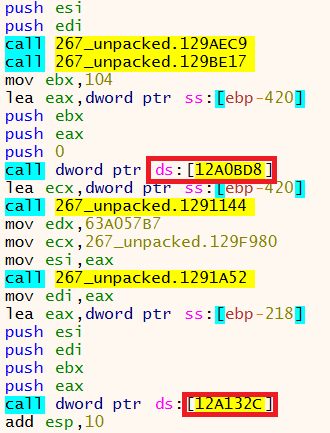
Function names in x64dbg before deobfuscation:
Function names in x64dbg after deobfuscation:
Searching for intermodular calls now shows an imported address table.
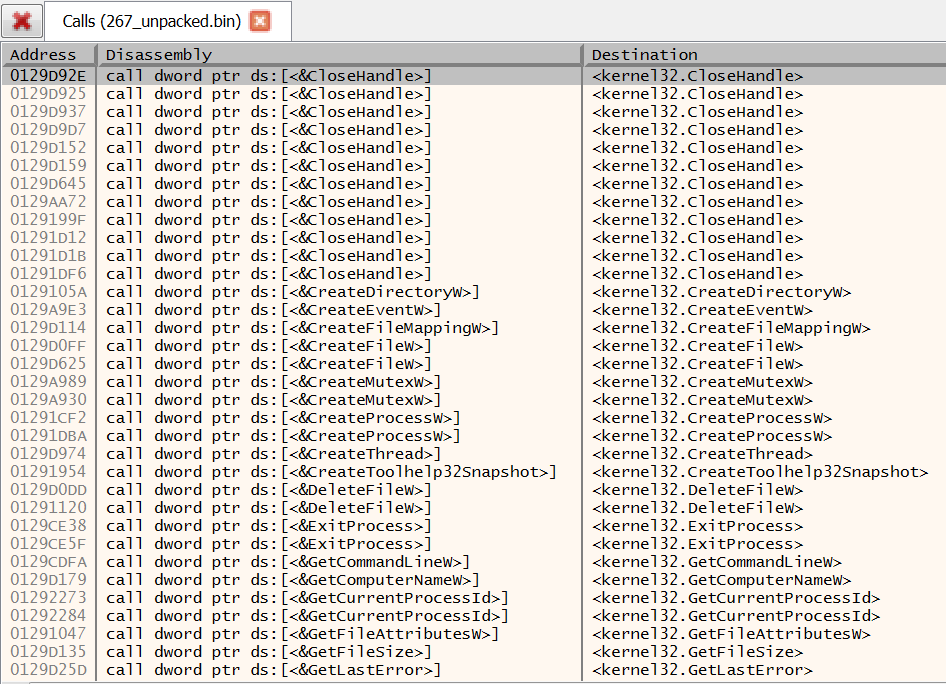
We can now identify functions of interest and begin to set breakpoints on API’s which may give us more information on what the malware is doing.
Setting Breakpoints
Now we have populated the IAT we now want to start looking at functions the malware has imported to see if they are being used, and if so, investigate what they are doing. Looking at the IAT some of the imported functionality is quite clear due to the naming conventions used such as ‘CreateDirectoryW’. However, to find where that function is being used in x64dbg we need to run the malware and set a breakpoint on the API so that it will stop before executing the function.
There are a few different ways of setting breakpoints. In the populated list we generated earlier you can right-click on a function you want to analyze and select ‘Toggle Breakpoint’. In the image below I am setting a breakpoint on CreateMutexW.
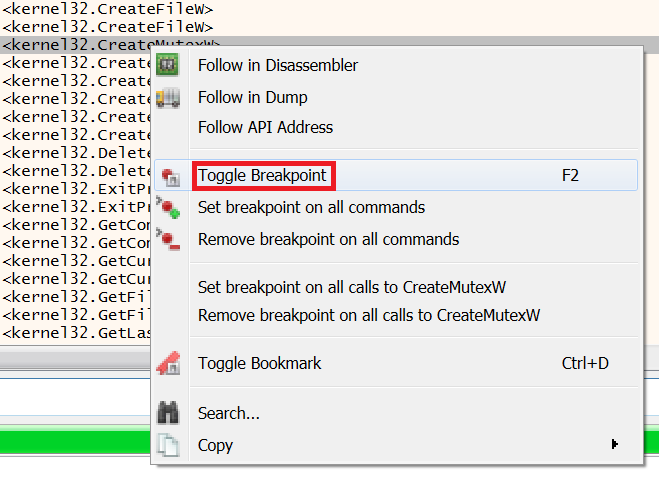
This then turns the address where this function resides to the color red to indicate the breakpoint has now been set.

Breakpoints can also be set from the command line at the foot of x64dbg. This is done by entering the syntax ‘bp’ followed by the name of the Windows API you want to set a breakpoint on, note the names of the API’s are case sensitive.
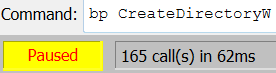
Press enter to set the breakpoint.
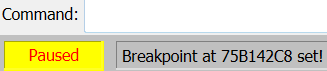
An updated message then appears to confirm the breakpoint has been set.
Another way to set a breakpoint is to use the keyboard shortcut ‘CTRL+G’ and again enter the name of a Windows API. If x64dbg finds the API in the malware it will show the message ‘Correct expression!’
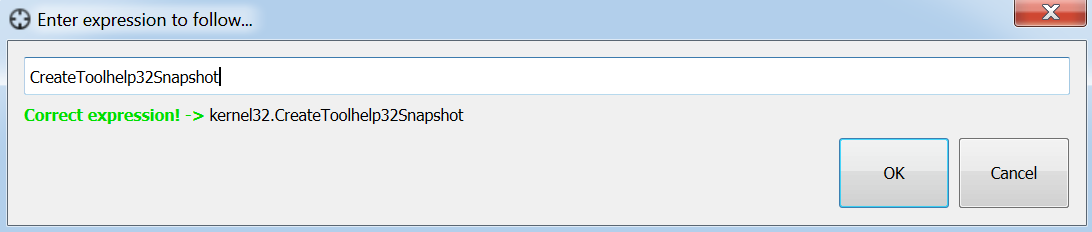
Pressing ‘OK’ will again generate a message at the bottom of x64dbg confirming the breakpoint has been set.
Selecting the ‘Breakpoints’ tab will confirm and display that the breakpoints have been set.

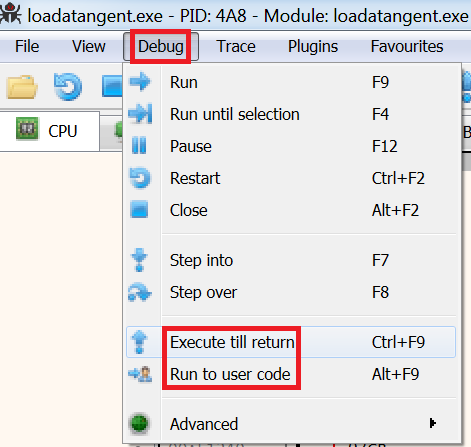
When a breakpoint is hit you may find yourself in the DLL where that API resides, to get to malware authors code simply select ‘Debug’ then ‘Execute till return’ or ‘Run to user code’.
Analyzing Imported Functions
As you analyze multiple malware samples you begin to recognize functions of interest that are used by the malware. ‘CreateMutexW’ is used to create what’s known as a ‘mutant’ or ‘mutex’. Mutexes are often used by malware to indicate that a machine has been infected, if the machine is infected again then the malware may run a check for the presence of a mutex and if one is found that is associated with that malware family then it won’t attempt to reinfect the device.
Hitting ‘run’ in x64dbg now runs the malware until one of our breakpoints is hit and the malware is paused. The first breakpoint hit is for ‘CreateMutexW’.

The black box on the left-hand side with the address written in red is the address where our breakpoint has stopped at the call to ‘CreateMutexW’. In the image above we can see that before this call is made, there are three push instructions, this is data being pushed onto the stack that will be used by the function. Using the x64dbg plugin ‘xAnalyzer’, we can see what these values relate to on the right-hand side.
To understand how a Windows function works simply google its name, the Microsoft documentation is very useful as it will outline what the function does, parameters that are used, and also what data is returned upon the function running successfully.
From checking the documentation for ‘CreateMutexW’ we can identify a parameter that is of interest.
Below is a screenshot for information relating to the parameter ‘lpname’ used by ‘CreateMutexW’.
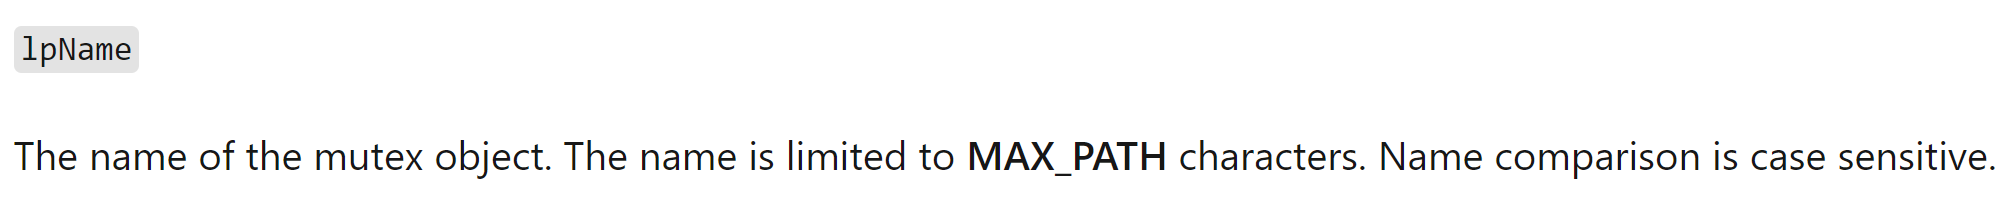
From this URL we now know that the ‘lpname’ field that was pushed onto the stack is the name being used by the malware to create a mutex – ‘Global\\MEAA53FEC’. Let’s take a closer look at this mutex in x64dbg to see how it generates this seemingly random name.
By scrolling up through the assembly code we can see that before the call to ‘CreateMutexW’ there was a call to ‘GetWindowsDirectoryW’ and ‘GetVolumeInformationW’.
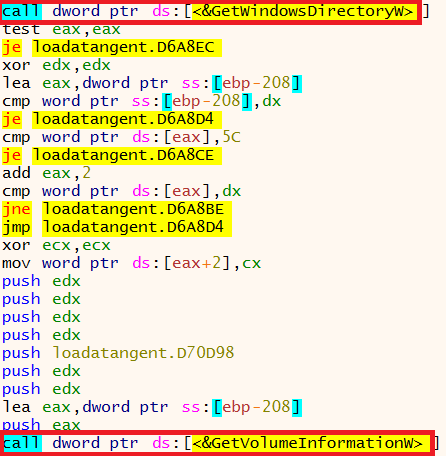
‘GetWindowsDirectoryW’ identifies the Windows directory location on the compromised device. We can check what ‘GetVolumeInformation’ does by googling the name of the API.
Going off this information the malware is pulling the name of the volume of the root directory, this indicates how the malware is potentially generating the name for the mutex.
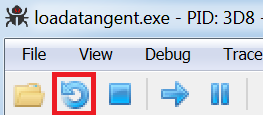
In order to take a closer look at what these functions are doing let’s restart the malware in x64dbg as these functions have been called before ‘CreateMutexW’. This is done by selecting the ‘Restart’ button.
The previous breakpoints that we set will have been saved but let’s now add a breakpoint for ‘GetVolumeInformationW’.
Running the malware again now takes us to our newly-created breakpoint.
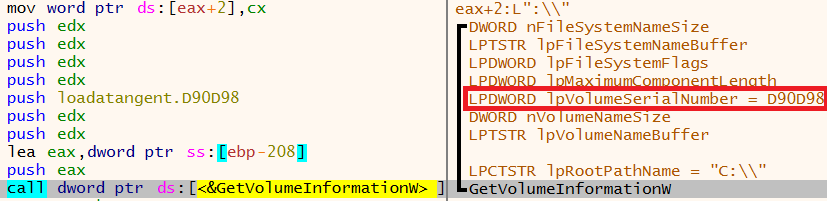
By looking at the parameters in x64dbg for ‘GetVolumeInformationW’ we can see one relates to ‘lpVolumeSerialNumber’, the Microsoft documentation confirms that the malware is grabbing the serial number of the device.
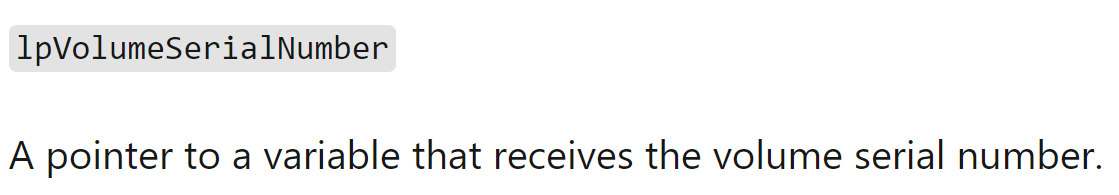
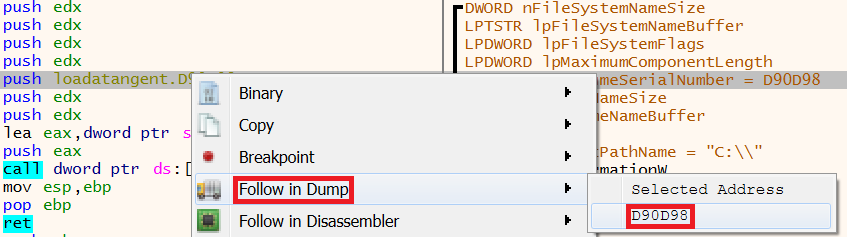
The documentation also tells us that this parameter is going to store the serial number in a variable. We can check this variable by right-clicking this parameter and selecting ‘Follow in Dump’ and then selecting the address being used for the variable.
x64dbg then presents us with the selected address that currently contains no data.
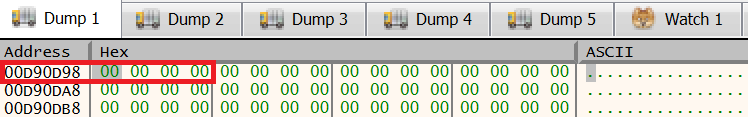
Stepping over the call to ‘GetVolumeInformationW’ then executes this function and the serial number has now appeared in the dump window.
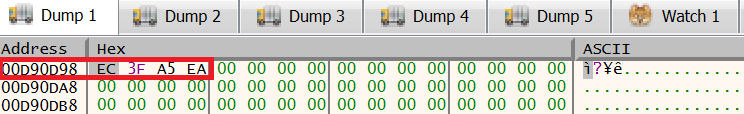
By opening up a command prompt on the VM we can identify the serial number of the device and confirm our findings by entering the command ‘vol c:’.
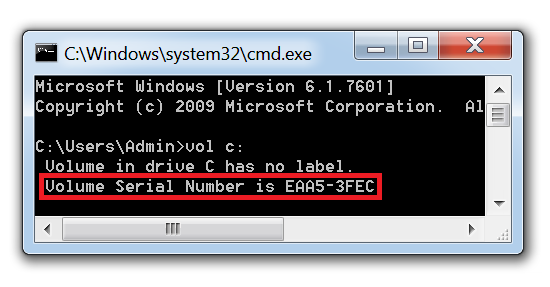
This matches the information in x64dbg however in x64dbg the data is reversed due to what’s known as endianness. From reverse-engineering a part of the malware we have now confirmed that the malware generates a unique mutex on a compromised device using the serial number.
This same methodology can now be applied to investigate other imported functions. Simply set a breakpoint against functions of interest and look at what parameters the function uses and what data is being pushed onto the stack. This will give you a wealth of information not attainable from behavioral analysis of the malware.
Closing:
That completes this four-part series on how to use x64dbg, from reading these blog posts and with a bit of practice you should now be able to confidently navigate your way around the tool and have a strong foundation of knowledge on which to build your malware analysis skills.
For more information on how Varonis can help your organization against the ever-changing threat landscape be sure to sign up for a demo of Datalert and also check out the best practices that you can implement for malware protection.


-1.png)