
There are numerous tools freely available to cybersecurity professionals to assist in analyzing malware. Ghidra was first released a couple of years ago and has proved to be relatively popular due to it being a free tool that can be used to disassemble malware.
However, a lot of people who are new to this type of tool often have difficulty learning how to use Ghidra. However as usual, when it comes to malware analysis I’ve got your back!
This article will cover what Ghidra is, how to install it and some helpful tips to help you get started using this tool for malware analysis
If you’re new to reverse engineering malware down to the level of analyzing assembly code then I recommend reading the following articles I have put together which will give you a strong foundation of knowledge to help you on your path to becoming a malware ninja:
- What is x64dbg & How to use it
- How to Unpack Malware with x64dbg
- Stack Memory: An Overview
- How to Analyze Malware with x64dbg
Get a Free Data Risk Assessment
What is Ghidra?
Ghidra is a reverse engineering tool that was developed by the NSA and released in 2019. This has proved especially popular with malware analysts as it’s what’s known as a disassembly tool. This allows a malware analyst to inspect the functionality of a malware sample without running it, this is extremely useful as the analyst is able to look through the code of the malware and map out what it is doing.
The difference between Ghidra and a tool such as x64dbg is that x64dbg is a debugger, meaning that it will actually run the malware as you step through and analyze the code. So if you find an interesting function in x64dbg, for example, that encrypts all files, it will run that function and encrypt all the files on the machine you are using for malware analysis.
A disassembly tool such as Ghidra doesn’t run the code, it maps out the assembly code of the malware and allows the user to step forward and backward through the code without impacting the filesystem of the analysis device. This makes Ghidra an ideal tool for identifying and mapping out functions that may be of further interest to a malware analyst.
Disclaimer: Ghidra should only be used in a sandboxed environment such as a virtual machine designed for analyzing malware, do not attempt to analyze malware on your host operating system.
How to install Ghidra
To install Ghidra on Windows, navigate to the official Ghidra website, you will be presented with the following page:

Select ‘Download from Github’, this will take you to the Ghidra Github page, where the latest version of the software can be downloaded.
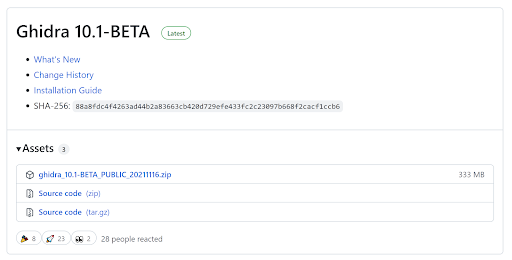
Download the zip file and extract the contents to a location of your choice, once extracted you should have the following files:
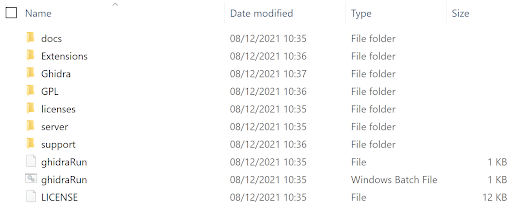
To launch Ghidra, double click the Windows batch file called ‘ghidraRun’, you may see the following error message:
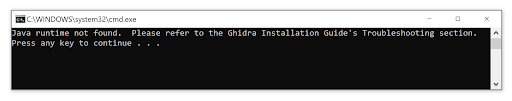
If this happens then use this video I created to quickly resolve the issue.
Once opened the following windows will be displayed, the ‘Active Project’ window and the ‘Tip of the Day’ window. The ‘Tip of the Day’ window is quite self-explanatory and can be closed.

To begin using Ghidra to analyze a sample you first need to create a project which is used to store the sample and any files generated by Ghidra.
To begin, select ‘File’, then ‘New Project’.

Select whether you want to share the project or not, in this example, I will choose ‘Non-Shared Project’ and click ‘Next’.

Next, give the project a name, this could be the name of the malware sample being analyzed, and click ‘Finish’. In this example, I have used ‘Varonis Demo’

We now have a newly created project and can drag malware samples into the project for analysis.
 In the image above we can see a file that has been added to the project called ‘remcos.exe’, and Ghidra is telling us it has identified the file as a 32bit Windows PE file.
Click ok and Ghidra will begin to import the file, the following status bar will be displayed:

Once the file has successfully been imported into Ghidra the following window will be displayed that provides details on the imported file.

Select ‘OK’, and then double click the name of the imported malware or press the dragon logo icon to open the code browser.
The following prompt will appear advising that Ghidra has not yet analyzed the file and asks if you would like to analyze it now, select ‘Yes’.

The following window will then be displayed regarding analysis options, from here select the option that I have highlighted called ‘WindowsPE x86 Propagate External Parameters’. This helps when analyzing an imported function as the parameters for the function that will be pushed onto the stack will be listed within the tool.

Select ‘Analyze’, and Ghidra will begin to analyze the file, the status bar at the bottom right-hand corner of Ghidra will display a status bar showing the progress of the analysis.

Once this has finished Ghidra is ready for you to begin reverse engineering the malware sample.
Reverse Engineering Using Ghidra
When you open a piece of malware in Ghidra that has been imported and analyzed by the tool you will see a number of windows.
Main Ghidra Windows
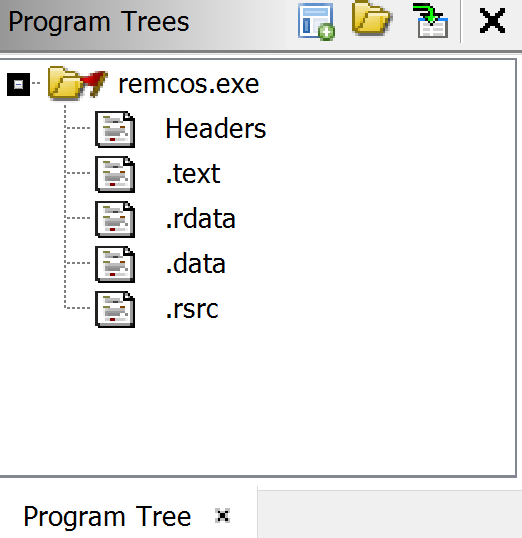
In the top left-hand corner, there is a window that contains the sections of the malware, this is the ‘Program Trees’ section. If you have used a tool such as PeStudio before then this should be familiar.
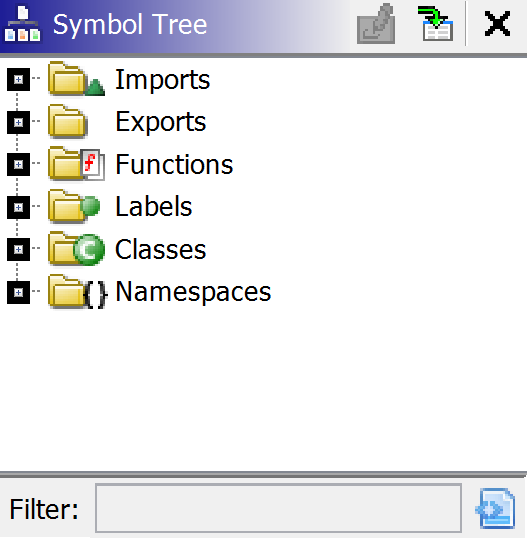
The ‘Symbol Tree’ section is very useful as this contains the imports, exports, and functions that the malware is using to perform its malicious activities.
By clicking on ‘Imports’ we can see which libraries have been imported by the malware, clicking on a DLL reveals the imported functions associated with that library.
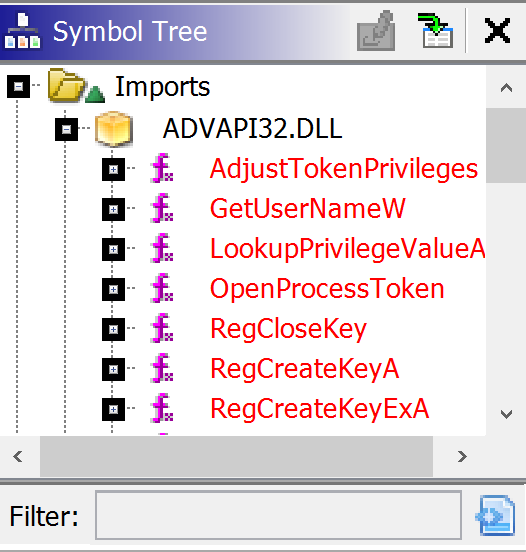
From looking through the imports it is then possible to identify any interesting functions that the malware is using, this is great for a malware analyst as it means we can double click on these imports to see if they are being used by the malware and try to understand what activity it may perform on a compromised host.
The same can be done with the Exports tab to see what functionality has been exported by the malware, however, there are no exports in the malware sample in this demo.
The ‘Symbol Tree’ contains all the functions that have been written by the malware author. When Ghidra imports and then analyses the malware, it will attempt to assign names to some of the functions based on the automated analysis it has performed. In the image below one of the functions is named ’CreateToolhelp32Snapshot’, this is the name of an imported function that is used to enumerate the running processes on a device, so Ghidra has seen this import being used in this function and named it accordingly.
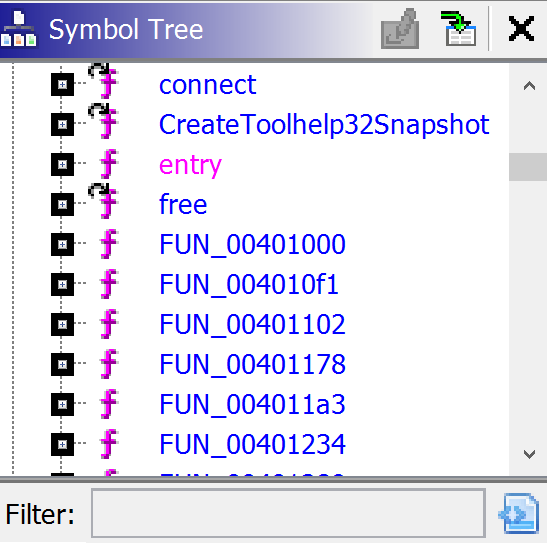
We can also see some functions that have a generic naming convention that begins with ‘FUN_’ and then a series of numbers. These are functions that have not been defined by Ghidra so are named ‘FUN_’, which is short for function, and then given a hexadecimal numeric value that represents where the function is located within the binary.
There is also a listing for ‘entry’, this is the entry point of the malware, and by double-clicking this the main ‘Listing’ window of Ghidra will be updated and display the assembly code at the entry point of the malware.

If you are not familiar with the information in the above image then be sure to check out the articles I listed at the start of this article as this is all covered in the previous content I have put together.
In the image above we can see the assembly instructions and information being pushed onto the stack and various calls being made. This information can give us an idea of what the malware is doing by focusing on any calls to interesting APIs that are listed in the ‘Symbol Tree’ window of Ghidra.
By clicking on ‘entry’, the ‘Decompile’ window will now be updated and contain some data. This window shows where Ghidra has attempted to convert the assembly code in the ‘Listing’ window into the C programming code. This allows the malware analyst to see what the malware author's code may have looked like and help assist with the analysis of the malware.

Function Graph
Another display that will assist with analysing malware is using the function graph, this can be used by selecting the ‘Display Function Graph’ icon on the Ghidra toolbar.
![]()
This will then launch a graphical representation of the function currently displayed in the ‘Listing’ window.

Zooming in on the graph allows the analyst to see more clearly what decisions are made by the malware and the flow taken by the malware depending on certain conditions.

In the image above I have highlighted where I have identified that the function is calling ‘GetStartupInfoA’ so this tells me that this function is retrieving the startup information of the compromised device.
Double-clicking on the name of any function that is being called within the graph will take the user to that function and update the display to show the newly selected function.
Searching Strings
By clicking on the ‘Windows’ option on the toolbar tab and selecting ‘Defined Strings’, Ghidra will list the strings within the executable.

This is useful as unpacked malware will often contain strings that may indicate what the malware is doing once it has compromised a host. Once this option has been selected the following window will be displayed:

Here we can see that the malware may be creating some persistence as the registry location ‘Software\\Microsoft\\Windows\CurrentVersion\Run’ is listed, this is a common persistence mechanism for malware.
There is also a file listed called ‘install.bat’, this would now be a file I would be interested in retrieving from analyzing the malware. Double clicking any of these strings will take you to where they are located in the binary so the ‘Listing’, ‘Decompile’ and ‘Function Graph’ views can all be used to further investigate where these strings are located and what and what the malware is doing with this data.
In the image below I have double clicked ‘install.bat’, the ‘Listing’ window has been updated to show where this string is located within the binary.

In the image above we can also see the string ‘XREF[1]’ and then the name of the function. Ghidra is telling the user that it has cross-referenced the string ‘install.bat’ and lists the name of the function where the string is located.
Double-clicking the function name will then display this function in the Ghidra ‘Listing’ window and where the string ‘install.bat’ is located.
For the sake of the demo let’s say that I have now analyzed this function and have found that install.bat is created on disk and when it is run it creates a run key that starts the malware whenever the compromised host is booted. Looking at the above image I will never remember the function called ‘FUN_00040560d’, so to assist with my analysis I will give it another name.
This can be done by right-clicking on the function and selecting ‘Edit Function’.

This will open the following window:

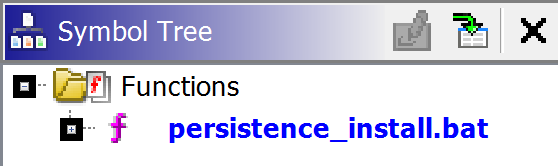
Using the ‘Function Name’ field, the name of the function can now be changed to something more memorable.

This is useful because the name of that function will now be changed across the project in Ghidra, this is now evident in the ‘Symbol Tree’ section under ‘Functions’:
Closing Comments
Ghidra is a useful tool to have in your arsenal of malware analysis tools. Hopefully, this article has given you an overview of how the tool can be used to further investigate specific functionality within a sample of malware. Remember when using a tool such as Ghidra it may be very time-consuming to start at the entry point and start analyzing every line of code.
Instead, use some of the features I have identified in this post, look at the functionality imported by the malware. What imports may be of interest, are there any that are used to connect the internet or encrypt data? If so, look at where these imports are used in the malware and see if you can identify what the malware is using these functions for. The same can be done with any interesting strings, look at where they are located in the malware and see what malware is doing with this data.
This type of mentality will allow you to investigate information that is of genuine interest to you rather than getting lost in a sea of assembly code!
If you are interested in finding out how Varonis can improve your organization's security posture then be sure to take a look at how Varonis can help you fight insider threats and ensure your company’s data is safe.